OPEN-SOURCE SCRIPT
Zaktualizowano Bollinger Bands %B + RSI

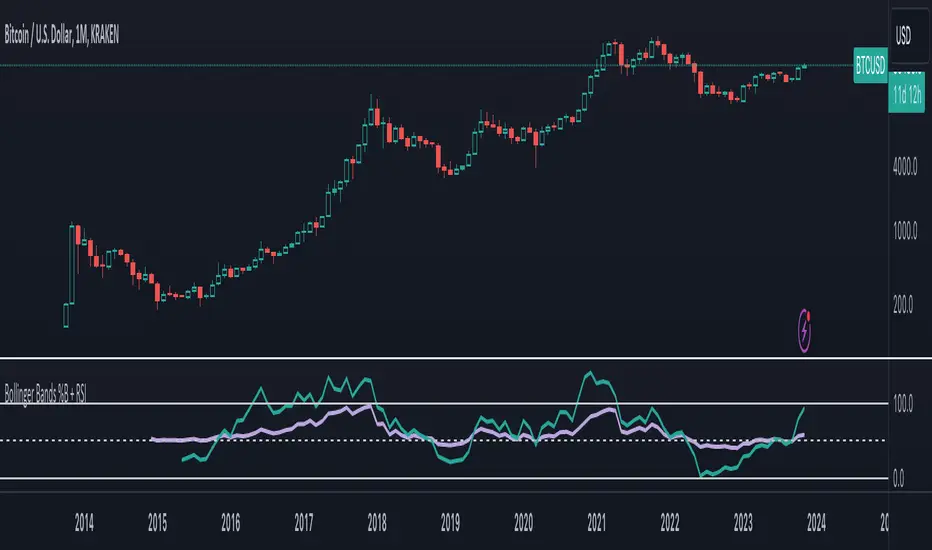
Bollinger Bands %b and RSI in one, and a experimental RSI cloud based in BB formula.
RSI scale goes from 0.00-1.00 instead of 0 -100.
RSI scale goes from 0.00-1.00 instead of 0 -100.
Informacje o Wersji
Changes settings to default values of original (RSi 14 periods and bb%b 20 periods).Added a subtile color change on bb%b when Stochastic do crossovers.
Changed values from 0-1 to 0-100, where bb%b over 100 is outside upper band and under 0 is outside lower band.
Informacje o Wersji
Fixed z-index on plots.Added stochastic color changes to rsi.
Informacje o Wersji
And now Hull MA crossover indications on bb%b (the teal line).The RSI show stochastic crossover (the purple line).
Strong color indicates upwards trend.
Pale color indicates downwards trend.
Informacje o Wersji
Added Hull.Informacje o Wersji
Updated script to Pinescript version 5.Skrypt open-source
W zgodzie z duchem TradingView twórca tego skryptu udostępnił go jako open-source, aby użytkownicy mogli przejrzeć i zweryfikować jego działanie. Ukłony dla autora. Korzystanie jest bezpłatne, jednak ponowna publikacja kodu podlega naszym Zasadom serwisu.
Wyłączenie odpowiedzialności
Informacje i publikacje nie stanowią i nie powinny być traktowane jako porady finansowe, inwestycyjne, tradingowe ani jakiekolwiek inne rekomendacje dostarczane lub zatwierdzone przez TradingView. Więcej informacji znajduje się w Warunkach użytkowania.
Skrypt open-source
W zgodzie z duchem TradingView twórca tego skryptu udostępnił go jako open-source, aby użytkownicy mogli przejrzeć i zweryfikować jego działanie. Ukłony dla autora. Korzystanie jest bezpłatne, jednak ponowna publikacja kodu podlega naszym Zasadom serwisu.
Wyłączenie odpowiedzialności
Informacje i publikacje nie stanowią i nie powinny być traktowane jako porady finansowe, inwestycyjne, tradingowe ani jakiekolwiek inne rekomendacje dostarczane lub zatwierdzone przez TradingView. Więcej informacji znajduje się w Warunkach użytkowania.

