OPEN-SOURCE SCRIPT
Zaktualizowano EMA Oracle and RSI
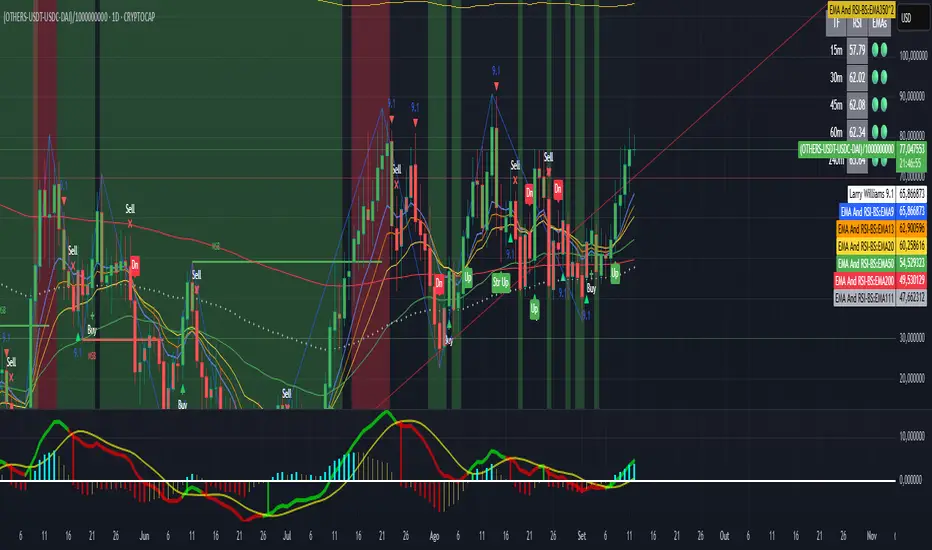
EMA Oracle
- “See the market’s structure through the eyes of exponential wisdom.”
combines classic EMA stacks with Pi-based logic to reveal high-probability buy/sell zones and trend bias across timeframes
Multi-EMA Trend & Pi Signal Indicator
This advanced indicator combines classic trend analysis with Pi-based signal logic to help traders identify optimal entry and exit zones across multiple timeframes.
Core Features
EMA Trend Structure: Displays EMAs 9, 13, 20, 50, and 200 to visualize short-term and long-term trend orientation. Bullish momentum is indicated when shorter EMAs are stacked above longer ones.
Pi-Based Signal Logic: Inspired by the Pi Indicator, it includes EMA111 and EMA700 (350×2) on the daily chart:
Buy Zone: When price is trading below EMA111, it signals potential accumulation for spot or low-leverage position trades.
Sell Zone: When price is above EMA700, it suggests potential distribution or exit zones.
Trend Cross Alerts: Detects EMA crossovers and crossunders to highlight shifts in market structure and generate buy/sell signals.
Multi-Timeframe Analysis: Evaluates trend direction across selected timeframes (e.g., 15m, 30m, 1h, 4h, 1D), offering a broader market perspective.
RSI Integration: Combines Relative Strength Index (RSI) readings with EMA positioning to assess momentum and overbought/oversold conditions.
Trend Table Display: A dynamic table summarizes the asset’s trend status per timeframe, showing:
RSI values
EMA alignment
Overall trend bias (bullish, bearish, neutral)
Informacje o Wersji
EMA Oracle*** Did a small change to correct the indicator of tendency on the table that is shown on the up right.
- “See the market’s structure through the eyes of exponential wisdom.”
combines classic EMA stacks with Pi-based logic to reveal high-probability buy/sell zones and trend bias across timeframes
Multi-EMA Trend & Pi Signal Indicator
This advanced indicator combines classic trend analysis with Pi-based signal logic to help traders identify optimal entry and exit zones across multiple timeframes.
Core Features
EMA Trend Structure: Displays EMAs 9, 13, 20, 50, and 200 to visualize short-term and long-term trend orientation. Bullish momentum is indicated when shorter EMAs are stacked above longer ones.
Pi-Based Signal Logic: Inspired by the Pi Indicator, it includes EMA111 and EMA700 (350×2) on the daily chart:
Buy Zone: When price is trading below EMA111, it signals potential accumulation for spot or low-leverage position trades.
Sell Zone: When price is above EMA700, it suggests potential distribution or exit zones.
Trend Cross Alerts: Detects EMA crossovers and crossunders to highlight shifts in market structure and generate buy/sell signals.
Multi-Timeframe Analysis: Evaluates trend direction across selected timeframes (e.g., 15m, 30m, 1h, 4h, 1D), offering a broader market perspective.
RSI Integration: Combines Relative Strength Index (RSI) readings with EMA positioning to assess momentum and overbought/oversold conditions.
Trend Table Display: A dynamic table summarizes the asset’s trend status per timeframe, showing:
RSI values
EMA alignment
Overall trend bias (bullish, bearish, neutral)
Informacje o Wersji
Made a few changes for stability and more friendly view. Since Pine Script has some limitations, the table from this indicator is best viewed in 1h TF.Informacje o Wersji
Improvements in the visualization, increasing transparency of the colors, you should try longs when green and have caution when red.Informacje o Wersji
Corrected a Minor error with RSISkrypt open-source
W duchu TradingView twórca tego skryptu udostępnił go jako open-source, aby traderzy mogli analizować i weryfikować jego funkcjonalność. Brawo dla autora! Możesz korzystać z niego za darmo, ale pamiętaj, że ponowna publikacja kodu podlega naszym Zasadom Społeczności.
Wyłączenie odpowiedzialności
Informacje i publikacje przygotowane przez TradingView lub jego użytkowników, prezentowane na tej stronie, nie stanowią rekomendacji ani porad handlowych, inwestycyjnych i finansowych i nie powinny być w ten sposób traktowane ani wykorzystywane. Więcej informacji na ten temat znajdziesz w naszym Regulaminie.
Skrypt open-source
W duchu TradingView twórca tego skryptu udostępnił go jako open-source, aby traderzy mogli analizować i weryfikować jego funkcjonalność. Brawo dla autora! Możesz korzystać z niego za darmo, ale pamiętaj, że ponowna publikacja kodu podlega naszym Zasadom Społeczności.
Wyłączenie odpowiedzialności
Informacje i publikacje przygotowane przez TradingView lub jego użytkowników, prezentowane na tej stronie, nie stanowią rekomendacji ani porad handlowych, inwestycyjnych i finansowych i nie powinny być w ten sposób traktowane ani wykorzystywane. Więcej informacji na ten temat znajdziesz w naszym Regulaminie.