OPEN-SOURCE SCRIPT
Zaktualizowano Bitcoin Pi Cycle Top Indicator - Daily Timeframe Only
1 Day Timeframe Only
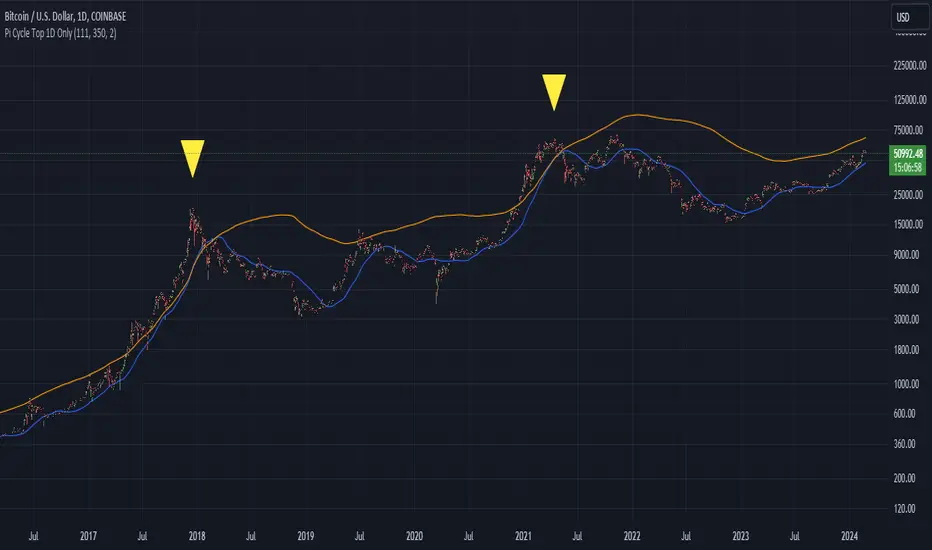
The Bitcoin Pi Cycle Top Indicator has garnered attention for its historical effectiveness in identifying the timing of Bitcoin's market cycle peaks with remarkable precision, typically within a margin of 3 days.
It utilizes a specific combination of moving averages—the 111-day moving average and a 2x multiple of the 350-day moving average—to signal potential tops in the Bitcoin market.
The 111-day moving average (MA): This shorter-term MA is chosen to reflect more recent price action and trends within the Bitcoin market.
The 350-day moving average (MA) multiplied by 2: This longer-term MA is adjusted to capture broader market trends and cycles over an extended period.
The key premise behind the Bitcoin Pi Cycle Top Indicator is that a potential market top for Bitcoin can be signaled when the 111-day MA crosses above the 350-day MA (which has been doubled). Historically, this crossover event has shown a remarkable correlation with the peaks of Bitcoin's price cycles, making it a tool of interest for traders and investors aiming to anticipate significant market shifts.
#Bitcoin
Informacje o Wersji
The Bitcoin Pi Cycle Top Indicator has garnered attention for its historical effectiveness in identifying the timing of Bitcoin's market cycle peaks with remarkable precision, typically within a margin of 3 days.It utilizes a specific combination of moving averages—the 111-day moving average and a 2x multiple of the 350-day moving average—to signal potential tops in the Bitcoin market.
The 111-day moving average (MA): This shorter-term MA is chosen to reflect more recent price action and trends within the Bitcoin market.
The 350-day moving average (MA) multiplied by 2: This longer-term MA is adjusted to capture broader market trends and cycles over an extended period.
The key premise behind the Bitcoin Pi Cycle Top Indicator is that a potential market top for Bitcoin can be signaled when the 111-day MA crosses above the 350-day MA (which has been doubled). Historically, this crossover event has shown a remarkable correlation with the peaks of Bitcoin's price cycles, making it a tool of interest for traders and investors aiming to anticipate significant market shifts.
#Bitcoin
Skrypt open-source
W zgodzie z duchem TradingView twórca tego skryptu udostępnił go jako open-source, aby użytkownicy mogli przejrzeć i zweryfikować jego działanie. Ukłony dla autora. Korzystanie jest bezpłatne, jednak ponowna publikacja kodu podlega naszym Zasadom serwisu.
Wyłączenie odpowiedzialności
Informacje i publikacje nie stanowią i nie powinny być traktowane jako porady finansowe, inwestycyjne, tradingowe ani jakiekolwiek inne rekomendacje dostarczane lub zatwierdzone przez TradingView. Więcej informacji znajduje się w Warunkach użytkowania.