OPEN-SOURCE SCRIPT
Zaktualizowano Hindenburg Omen [QuantNomad]
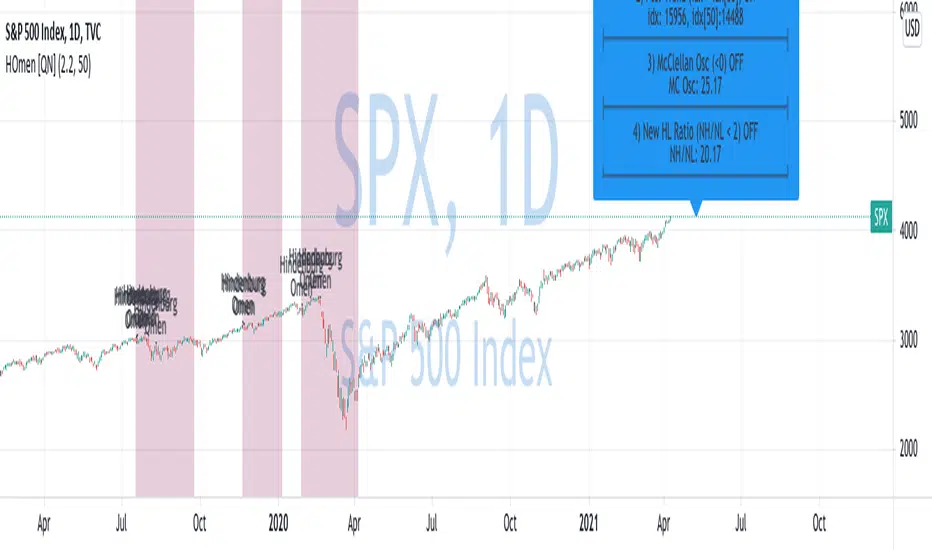
New record highs is good time to look at a market crash indicators )
This is a Hindenburg Omen indicator.
The Hindenburg Omen looks for a statistical deviation from the premise that under normal conditions, securities are either making new 52-week highs or 52-week lows. The abnormality would be if both were occurring at the same time. According to the Hindenburg Omen, an occurrence such as this is considered to be a harbinger of impending danger for a stock market. The signal typically occurs during an uptrend, where new highs are expected and new lows are rare, suggesting that the market is becoming nervous and indecisive, traits that often lead to a bear market.
For it to be on 4 conditions should be satisfied:
1. Number of new 52-week highs and 52-week lows in a stock market are greater than a threshold (2.2% for example).
2. Positive recent trend. Index > index[50]
3. The McClellan Oscillator (MCO) is negative.
4. 52-week highs cannot be more than two times the 52-week lows.
You can read more about the indicator on Investopedia:
investopedia.com/terms/h/hindenburgomen.asp
Based on indicator created by Boombotcom:
Informacje o Wersji
I fixed data sources for indicator. Thanks to Marcus for providing me info on new sources. Skrypt open-source
W zgodzie z duchem TradingView twórca tego skryptu udostępnił go jako open-source, aby użytkownicy mogli przejrzeć i zweryfikować jego działanie. Ukłony dla autora. Korzystanie jest bezpłatne, jednak ponowna publikacja kodu podlega naszym Zasadom serwisu.
💻 Online Courses and Access to PRO Indicators in the QuanTribe community: qntly.com/qt
💼 Hire Us: qntly.com/pine
📞 Book a call: qntly.com/cons
📰 qntly.com/news
𝕏: qntly.com/x
📩 qntly.com/tel
💼 Hire Us: qntly.com/pine
📞 Book a call: qntly.com/cons
📰 qntly.com/news
𝕏: qntly.com/x
📩 qntly.com/tel
Wyłączenie odpowiedzialności
Informacje i publikacje nie stanowią i nie powinny być traktowane jako porady finansowe, inwestycyjne, tradingowe ani jakiekolwiek inne rekomendacje dostarczane lub zatwierdzone przez TradingView. Więcej informacji znajduje się w Warunkach użytkowania.
Skrypt open-source
W zgodzie z duchem TradingView twórca tego skryptu udostępnił go jako open-source, aby użytkownicy mogli przejrzeć i zweryfikować jego działanie. Ukłony dla autora. Korzystanie jest bezpłatne, jednak ponowna publikacja kodu podlega naszym Zasadom serwisu.
💻 Online Courses and Access to PRO Indicators in the QuanTribe community: qntly.com/qt
💼 Hire Us: qntly.com/pine
📞 Book a call: qntly.com/cons
📰 qntly.com/news
𝕏: qntly.com/x
📩 qntly.com/tel
💼 Hire Us: qntly.com/pine
📞 Book a call: qntly.com/cons
📰 qntly.com/news
𝕏: qntly.com/x
📩 qntly.com/tel
Wyłączenie odpowiedzialności
Informacje i publikacje nie stanowią i nie powinny być traktowane jako porady finansowe, inwestycyjne, tradingowe ani jakiekolwiek inne rekomendacje dostarczane lub zatwierdzone przez TradingView. Więcej informacji znajduje się w Warunkach użytkowania.