OPEN-SOURCE SCRIPT
Zaktualizowano MTF Analysis
MTF Analysis - Multi-Timeframe TradingView Script
Overview: The "MTF Analysis" script provides a comprehensive approach to analyzing price trends across daily, weekly, and monthly timeframes using linear regression channels. It helps traders identify strong and weak bullish or bearish conditions based on the relationship between the current price and regression lines derived from multiple timeframes.
Key Features:
User-Defined Inputs:
Regression Lengths: Customize regression lengths for daily, weekly, and monthly timeframes.
Smoothing Length: Apply smoothing to regression lines.
Near-Zero Threshold: Filter out signals near a defined slope threshold for more refined analysis.
Daily Time Frame Filter: Optional filter to consider daily regression slope in signal generation.
Regression Line Calculation:
The script calculates linear regression lines for each timeframe (daily, weekly, monthly) and applies a smoothing function to refine the signals.
Signal Conditions:
Strong Bullish/Bearish: Signals generated when the price is consistently above/below weekly and monthly regression lines, with the option to apply the daily timeframe filter.
Weak Bullish/Bearish: Signals generated when the price is above/below the monthly regression line alone.
Visual Indicators:
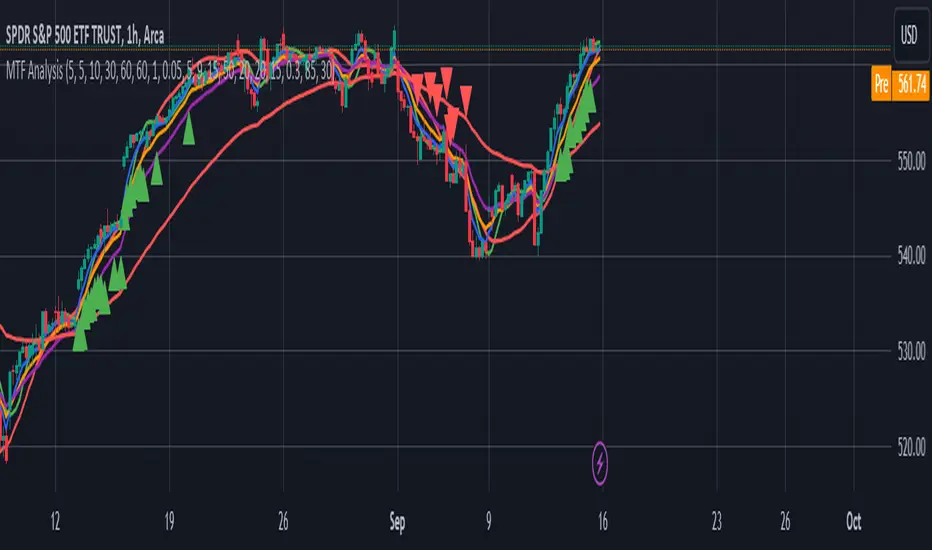
The script plots regression lines on the chart with different colors for easy identification.
It also displays arrows on the chart to indicate strong or weak bullish/bearish signals.
Alerts:
Custom alerts for each signal condition help traders stay informed of potential trading opportunities.
This script is highly customizable, allowing traders to tailor it to their specific trading style and preferences.
This summary can be used to introduce the script to other traders or for publication on platforms like TradingView.
Overview: The "MTF Analysis" script provides a comprehensive approach to analyzing price trends across daily, weekly, and monthly timeframes using linear regression channels. It helps traders identify strong and weak bullish or bearish conditions based on the relationship between the current price and regression lines derived from multiple timeframes.
Key Features:
User-Defined Inputs:
Regression Lengths: Customize regression lengths for daily, weekly, and monthly timeframes.
Smoothing Length: Apply smoothing to regression lines.
Near-Zero Threshold: Filter out signals near a defined slope threshold for more refined analysis.
Daily Time Frame Filter: Optional filter to consider daily regression slope in signal generation.
Regression Line Calculation:
The script calculates linear regression lines for each timeframe (daily, weekly, monthly) and applies a smoothing function to refine the signals.
Signal Conditions:
Strong Bullish/Bearish: Signals generated when the price is consistently above/below weekly and monthly regression lines, with the option to apply the daily timeframe filter.
Weak Bullish/Bearish: Signals generated when the price is above/below the monthly regression line alone.
Visual Indicators:
The script plots regression lines on the chart with different colors for easy identification.
It also displays arrows on the chart to indicate strong or weak bullish/bearish signals.
Alerts:
Custom alerts for each signal condition help traders stay informed of potential trading opportunities.
This script is highly customizable, allowing traders to tailor it to their specific trading style and preferences.
This summary can be used to introduce the script to other traders or for publication on platforms like TradingView.
Informacje o Wersji
The script is designed for TradingView and calculates linear regression lines across multiple timeframes (daily, weekly, and monthly). It includes user inputs to customize the regression lengths, smoothing length, and source price. The script also incorporates adjustments for US Federal Funds Rate, bond prices, and VIX if enabled.The script identifies strong and weak bullish and bearish signals based on the relationship between the source price and the smoothed regression lines. Users can enable filters for trend-based signals and conflicting signals.
Additionally, the script allows for a specific daily time frame filter regression length, enhancing its adaptability to various trading strategies.
Alerts are generated for detected signals, and visual markers are plotted on the chart to indicate these signals. The script is highly customizable, making it suitable for traders who want to analyze market trends using regression analysis.
Informacje o Wersji
Purpose and BenefitsPurpose: MTF Analysis aims to provide a comprehensive trading strategy by analyzing price trends across multiple timeframes and applying various technical filters. The goal is to generate reliable trading signals that reflect the overall market direction.
Benefits:
Multi-Timeframe Analysis: By considering different timeframes, the strategy captures a more holistic view of market trends, helping traders make more informed decisions.
Customization: Traders can tailor the strategy to their preferences and market conditions, making it adaptable to different trading styles.
Enhanced Signal Reliability: The combination of trend filtering, EMA analysis, and macroeconomic adjustments helps reduce false signals, potentially improving the win rate and profitability of trades.
Informacje o Wersji
This script provides a multi-timeframe analysis with dynamic filters to generate trading signals based on regression lines, EMA ribbons, RSI, and other filters. The goal is to maximize signal accuracy by optimizing user settings and toggles.Key Components:
Moving Average and Regression Settings:
Daily and Weekly MA Lengths: Simple moving averages (SMA) calculated over user-defined lengths.
Daily and Weekly Regressions: Linear regressions applied to the MAs over user-defined lengths to detect trends.
Signal Determination:
Strong Bullish Signal: Price is above both daily and weekly regression lines.
Weak Bullish Signal: Price is above the daily but below the weekly regression line.
Strong Bearish Signal: Price is below both regression lines.
Weak Bearish Signal: Price is below the daily but above the weekly regression line.
RSI Filter:
RSI Calculation: Relative Strength Index (RSI) is calculated over a user-defined length.
RSI Moving Average and Slope: The slope of a user-defined moving average of the RSI is used to filter signals.
Near-Zero Threshold: A threshold is applied to detect when the RSI slope is near zero, allowing the script to suppress signals when the momentum is weak.
EMA Ribbon Filter:
EMAs (5, 9, 20, 50) are calculated and used to confirm the trend.
Bullish Trend: All EMAs in ascending order.
Bearish Trend: All EMAs in descending order.
Additional Filters:
Pattern Filter: Detects bullish and bearish patterns (e.g., engulfing, hammer, shooting star) to confirm or suppress signals.
Pivot Point Filter: Validates signals based on whether the price is above or below the pivot point.
Signal Conflict Resolution:
Ensures only one signal (bullish or bearish) is displayed by resolving conflicts between strong and weak signals using a hierarchy.
Optimized Settings:
The settings (e.g., MA lengths, RSI lengths, EMA lengths, regression lengths, thresholds) have been optimized for the best win rate.
This approach integrates various filters and signal conditions to help users make informed trading decisions based on market trends and momentum.
Informacje o Wersji
# MTF Analysis IndicatorThe **MTF Analysis** (Multi-Time Frame Analysis) indicator is a comprehensive tool designed for TradingView that combines multiple technical analysis methods to help traders identify potential trading opportunities. It integrates moving averages, linear regression lines, pivot points, support/resistance levels, and various filters to generate bullish and bearish signals.
## **Key Features**
### **1. Moving Averages and Linear Regression**
- **Exponential Moving Averages (EMAs):**
- Calculates daily and weekly EMAs based on user-defined lengths.
- Additional EMAs (5, 9, 15, and 50 periods) form an EMA ribbon for trend analysis.
- **Linear Regression Lines:**
- Applies linear regression to the EMAs over specified periods.
- Uses dynamic timeframes for daily and weekly regression analysis.
- **Visualization:**
- Plots the EMAs and regression lines on the chart for visual reference.
### **2. Pivot Points and Support/Resistance Levels**
- **Pivot Point Calculation:**
- Computes pivot points using the previous period's high, low, and close prices.
- **Support and Resistance Levels:**
- Calculates three levels each of support (S1, S2, S3) and resistance (R1, R2, R3).
- **Visualization:**
- Plots pivot points and support/resistance levels on the chart.
### **3. Signal Generation Logic**
- **Signal Types:**
- **Strong Bullish:** Price is above both daily and weekly regression lines.
- **Weak Bullish:** Price is above the daily but below the weekly regression line.
- **Strong Bearish:** Price is below both daily and weekly regression lines.
- **Weak Bearish:** Price is below the daily but above the weekly regression line.
- **Filters Applied:**
- **Signal Conflict Filter:** Resolves conflicting signals to prioritize stronger trends.
- **Neutral Trend Filter:** Eliminates signals during sideways market conditions.
- **EMA Ribbon Filter:** Confirms trend strength using the alignment of multiple EMAs.
- **RSI Filter:** Uses the Relative Strength Index to assess momentum and overbought/oversold conditions.
- **Pivot Point Filter:** Validates signals based on the price relative to the pivot point.
- **Pattern Filter:** Identifies candlestick patterns like engulfing patterns and hammers to refine signals.
### **4. Alerts**
- **Customizable Alerts:**
- Sets up alerts for each signal type, enabling traders to receive notifications when specific conditions are met.
## **Customization and Settings**
The indicator offers extensive customization options grouped into categories:
### **Moving Average and Regression Settings**
- **Daily EMA Length:** Sets the period for the daily EMA.
- **Weekly EMA Length:** Sets the period for the weekly EMA.
- **Daily Regression Length:** Defines the period over which the daily regression line is calculated.
- **Weekly Regression Length:** Defines the period for the weekly regression line.
### **Timeframe Selection**
- **Daily Timeframe:** Selects the timeframe for the daily regression analysis.
- **Weekly Timeframe:** Selects the timeframe for the weekly regression analysis.
### **Signal Conflict Settings**
- **Enable Signal Hierarchy and Conflict Filter:** Toggles the filter that resolves conflicting signals.
### **Neutral Trend Filter Settings**
- **Enable Neutral Trend Filter:** Activates the filter to eliminate signals during neutral market conditions.
- **Neutral Slope Threshold:** Sets the slope threshold to define a neutral trend.
- **EMA Convergence Threshold:** Defines the threshold for EMA convergence to identify sideways markets.
### **EMA Filter Settings**
- **Enable EMA Ribbon Filter:** Toggles the filter that uses EMA alignment to confirm trends.
- **EMA Lengths:** Allows customization of the periods for EMA 5, EMA 9, EMA 15, and EMA 50.
### **RSI Filter Settings**
- **Enable RSI Filter:** Activates the RSI-based filter.
- **RSI Length:** Sets the period for the RSI calculation.
- **RSI MA Length:** Defines the moving average period applied to the RSI.
- **RSI Slope Length:** Sets the period over which the RSI slope is calculated.
- **RSI Near-Zero Slope Threshold:** Defines the threshold to consider the RSI slope as flat.
- **RSI Overbought/Oversold Levels:** Sets the RSI levels to identify overbought and oversold conditions.
### **Pivot Points**
- **Enable Pivot Point Filter:** Toggles the filter that validates signals based on pivot points.
### **Pattern Filter Settings**
- **Enable Pattern Filter:** Activates the candlestick pattern recognition filter.
## **How to Use the Indicator**
1. **Add the Indicator to Your Chart:**
- Search for "MTF Analysis" in the TradingView indicators library and apply it to your chart.
2. **Configure the Settings:**
- Adjust the parameters in each settings group to align with your trading strategy.
- Enable or disable filters based on your preferences.
3. **Interpret the Signals:**
- **Strong Bullish Signal:**
- Indicates a strong upward trend.
- Consider looking for buying opportunities.
- **Weak Bullish Signal:**
- Suggests a potential upward movement.
- Exercise caution and look for additional confirmation.
- **Strong Bearish Signal:**
- Indicates a strong downward trend.
- Consider looking for selling or shorting opportunities.
- **Weak Bearish Signal:**
- Suggests a potential downward movement.
- Exercise caution and seek further validation.
4. **Monitor Alerts:**
- Set up alerts to receive notifications when signals are generated.
- Use the alerts to stay informed without constantly monitoring the chart.
## **Tips for Effective Use**
- **Combine with Other Analysis:**
- Use the indicator in conjunction with other technical analysis tools and fundamental insights.
- **Adjust Filters Carefully:**
- Enabling more filters can improve signal accuracy but may reduce the number of signals.
- Test different settings to find the optimal balance for your trading style.
- **Backtesting:**
- Utilize TradingView's backtesting features to assess how the indicator would have performed historically with your settings.
- **Risk Management:**
- Always employ proper risk management techniques.
- Do not rely solely on the indicator for trading decisions.
## **Conclusion**
The **MTF Analysis** indicator is a versatile tool that provides a multi-dimensional view of the market by integrating various technical analysis components. By customizing its extensive settings, traders can tailor the indicator to fit their specific needs and enhance their trading strategies.
Skrypt open-source
W zgodzie z duchem TradingView twórca tego skryptu udostępnił go jako open-source, aby użytkownicy mogli przejrzeć i zweryfikować jego działanie. Ukłony dla autora. Korzystanie jest bezpłatne, jednak ponowna publikacja kodu podlega naszym Zasadom serwisu.
Wyłączenie odpowiedzialności
Informacje i publikacje nie stanowią i nie powinny być traktowane jako porady finansowe, inwestycyjne, tradingowe ani jakiekolwiek inne rekomendacje dostarczane lub zatwierdzone przez TradingView. Więcej informacji znajduje się w Warunkach użytkowania.