PROTECTED SOURCE SCRIPT
Malama's MTF MA Alignment Scanner
Malama's Multi-Timeframe Moving Average Alignment Scanner (MTF MA Scanner) is an overlay indicator designed to simplify trend analysis by evaluating the alignment of multiple moving averages (MAs) across user-defined timeframes. It scans for bullish (MAs stacked ascending), bearish (descending), or mixed/neutral configurations, incorporating a VWAP (Volume Weighted Average Price) filter to contextualize price position relative to volume-based equilibrium. The result is a compact dashboard table summarizing signals from up to three timeframes, helping traders spot confluence for entries or reversals without manually switching charts. This tool draws from classic MA ribbon concepts but adds flexible MA types, dynamic sorting, and an overall trend score for quicker multi-TF insights.
Core Mechanics
The indicator processes data in layers to detect alignment and bias:
Moving Average Calculation: Supports five customizable MAs per timeframe, with types including Simple (SMA), Exponential (EMA), Double Exponential (DEMA for reduced lag), Smoothed (SMMA), or Butterworth 2-Pole filter (a low-lag recursive smoother approximating Ehlers' design for cleaner signals). Defaults use EMAs at lengths 6, 9, 21, 56, and 200—shorter for fast trends, longer for structure. Users enable/disable each independently.
Alignment Detection: For enabled MAs, it dynamically sorts them by length (shortest first) and checks their relative order: All ascending (shortest MA > longest) signals "Bullish" (uptrend strength); all descending signals "Bearish" (downtrend); otherwise "Mixed" or "Neutral" (if <2 MAs). This avoids bias from unsorted plots.
VWAP Integration: Computes session-anchored VWAP (daily/weekly/monthly) as a volume-weighted mean, classifying price as "Above" (bullish bias) or "Below" (bearish) to filter alignments—e.g., bullish MA stack above VWAP strengthens longs.
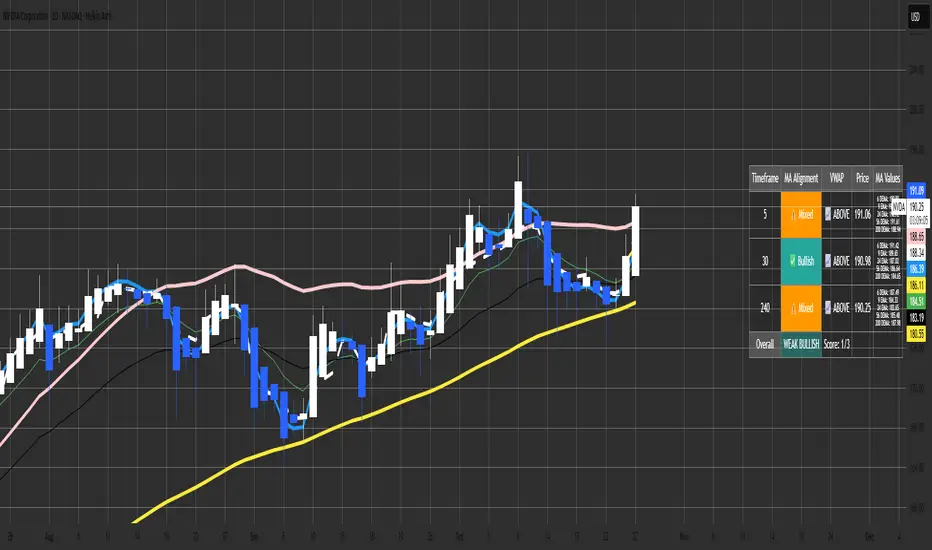
Multi-Timeframe Aggregation: Pulls MA and VWAP data from up to three timeframes (e.g., current, 5m, 15m) using secure requests without lookahead bias. It consolidates into a table: Per-TF rows show alignment status (with icons: ✅ Bullish, ❌ Bearish, ⚠️ Mixed, ➖ Neutral), VWAP icon/status (📈 Above, 📉 Below), current price, and optional MA values (e.g., "9 EMA: 1.2345").
Overall Summary: Counts bullish/bearish TFs for a net score (e.g., 2/3 bullish = "Weak Bullish"), highlighting confluence in the final row.
This setup emphasizes regime detection: Aligned short-term MAs confirm momentum, while longer ones validate structure, all filtered by VWAP for volume context.
Why This Adds Value & Originality
Standard MA crossovers or ribbons often clutter charts or require manual TF switches, leading to analysis fatigue. Here, the mashup of diverse MA types (e.g., lag-reduced DEMA with smooth Butterworth) into a sortable alignment check creates a "trend thermometer" that's adaptable—e.g., EMAs for responsiveness in forex, SMAs for stocks. The VWAP layer adds a fair-value anchor absent in pure MA tools, while the dashboard condenses MTF data into one glanceable view with a net score, reducing cognitive load. It's not a simple merge: Dynamic UDT-based sorting ensures consistent evaluation regardless of user tweaks, and optional value display aids precise level targeting. This makes it uniquely practical for confluence trading, evolving basic alignment into a scannable system without repainting risks.
How to Use
Setup: Add to your chart (overlay=true). In inputs: Enable TFs (e.g., 1H for structure, 15m/5m for entries); customize MAs (e.g., switch to DEMA for volatile crypto); set VWAP anchor (Daily for intraday). Toggle table position/size and chart plots.
Interpret the Dashboard (top-right default):
Per-TF Rows: Green cells for Bullish (long bias); red for Bearish (short); orange for Mixed (caution); gray for Neutral/low data. Check VWAP for confirmation—e.g., Bullish + Above = strong buy setup.
MA Values Column (if enabled): Lists current levels (e.g., "21 EMA: 4500.50") for support/resistance pulls.
Overall Row: "Strong Bullish" (all green) for aggressive longs; "Weak" variants for scaled entries. Score like "2/3" shows TF agreement.
Trading Application: On a 1H chart, look for 3/3 Bullish with price above VWAP for longs—enter on pullback to shortest MA. Use alerts (e.g., "All Timeframes Bullish") for notifications. Best on liquid assets (e.g., EURUSD, SPX) across 15m-4H. Combine with price action for edges.
Customization Tips: Disable unused MAs to declutter; test Butterworth on noisy data for smoother aligns.
Limitations & Disclaimer
Alignments lag by MA lengths and TF resolutions, so they're directional filters—not precise entries (pair with candlesticks). VWAP resets on anchors, potentially skewing mid-session. In sideways markets, "Mixed" dominates—avoid forcing trades. No built-in risk management; backtest on your symbols (e.g., via Strategy Tester) to validate. Results use historical data without guarantees—markets evolve. Not financial advice; trade at your own risk. For feedback, comment publicly.1.1s
Core Mechanics
The indicator processes data in layers to detect alignment and bias:
Moving Average Calculation: Supports five customizable MAs per timeframe, with types including Simple (SMA), Exponential (EMA), Double Exponential (DEMA for reduced lag), Smoothed (SMMA), or Butterworth 2-Pole filter (a low-lag recursive smoother approximating Ehlers' design for cleaner signals). Defaults use EMAs at lengths 6, 9, 21, 56, and 200—shorter for fast trends, longer for structure. Users enable/disable each independently.
Alignment Detection: For enabled MAs, it dynamically sorts them by length (shortest first) and checks their relative order: All ascending (shortest MA > longest) signals "Bullish" (uptrend strength); all descending signals "Bearish" (downtrend); otherwise "Mixed" or "Neutral" (if <2 MAs). This avoids bias from unsorted plots.
VWAP Integration: Computes session-anchored VWAP (daily/weekly/monthly) as a volume-weighted mean, classifying price as "Above" (bullish bias) or "Below" (bearish) to filter alignments—e.g., bullish MA stack above VWAP strengthens longs.
Multi-Timeframe Aggregation: Pulls MA and VWAP data from up to three timeframes (e.g., current, 5m, 15m) using secure requests without lookahead bias. It consolidates into a table: Per-TF rows show alignment status (with icons: ✅ Bullish, ❌ Bearish, ⚠️ Mixed, ➖ Neutral), VWAP icon/status (📈 Above, 📉 Below), current price, and optional MA values (e.g., "9 EMA: 1.2345").
Overall Summary: Counts bullish/bearish TFs for a net score (e.g., 2/3 bullish = "Weak Bullish"), highlighting confluence in the final row.
This setup emphasizes regime detection: Aligned short-term MAs confirm momentum, while longer ones validate structure, all filtered by VWAP for volume context.
Why This Adds Value & Originality
Standard MA crossovers or ribbons often clutter charts or require manual TF switches, leading to analysis fatigue. Here, the mashup of diverse MA types (e.g., lag-reduced DEMA with smooth Butterworth) into a sortable alignment check creates a "trend thermometer" that's adaptable—e.g., EMAs for responsiveness in forex, SMAs for stocks. The VWAP layer adds a fair-value anchor absent in pure MA tools, while the dashboard condenses MTF data into one glanceable view with a net score, reducing cognitive load. It's not a simple merge: Dynamic UDT-based sorting ensures consistent evaluation regardless of user tweaks, and optional value display aids precise level targeting. This makes it uniquely practical for confluence trading, evolving basic alignment into a scannable system without repainting risks.
How to Use
Setup: Add to your chart (overlay=true). In inputs: Enable TFs (e.g., 1H for structure, 15m/5m for entries); customize MAs (e.g., switch to DEMA for volatile crypto); set VWAP anchor (Daily for intraday). Toggle table position/size and chart plots.
Interpret the Dashboard (top-right default):
Per-TF Rows: Green cells for Bullish (long bias); red for Bearish (short); orange for Mixed (caution); gray for Neutral/low data. Check VWAP for confirmation—e.g., Bullish + Above = strong buy setup.
MA Values Column (if enabled): Lists current levels (e.g., "21 EMA: 4500.50") for support/resistance pulls.
Overall Row: "Strong Bullish" (all green) for aggressive longs; "Weak" variants for scaled entries. Score like "2/3" shows TF agreement.
Trading Application: On a 1H chart, look for 3/3 Bullish with price above VWAP for longs—enter on pullback to shortest MA. Use alerts (e.g., "All Timeframes Bullish") for notifications. Best on liquid assets (e.g., EURUSD, SPX) across 15m-4H. Combine with price action for edges.
Customization Tips: Disable unused MAs to declutter; test Butterworth on noisy data for smoother aligns.
Limitations & Disclaimer
Alignments lag by MA lengths and TF resolutions, so they're directional filters—not precise entries (pair with candlesticks). VWAP resets on anchors, potentially skewing mid-session. In sideways markets, "Mixed" dominates—avoid forcing trades. No built-in risk management; backtest on your symbols (e.g., via Strategy Tester) to validate. Results use historical data without guarantees—markets evolve. Not financial advice; trade at your own risk. For feedback, comment publicly.1.1s
Skrypt chroniony
Ten skrypt został opublikowany jako zamknięty kod źródłowy. Można z tego korzystać swobodnie i bez żadnych ograniczeń — więcej informacji znajduje się tutaj.
Wyłączenie odpowiedzialności
Informacje i publikacje nie stanowią i nie powinny być traktowane jako porady finansowe, inwestycyjne, tradingowe ani jakiekolwiek inne rekomendacje dostarczane lub zatwierdzone przez TradingView. Więcej informacji znajduje się w Warunkach użytkowania.