OPEN-SOURCE SCRIPT
Trend Detector

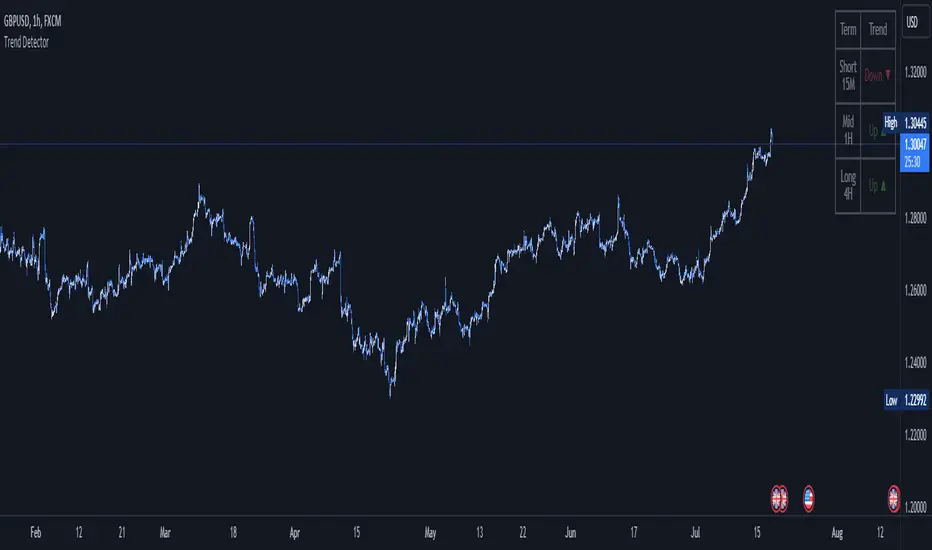
The Trend Detector indicator is a powerful tool to help traders identify and visualize market trends with ease. This indicator uses multiple moving averages (MAs) of different timeframes to provide a comprehensive view of market trends, making it suitable for traders of all experience levels.
█ USAGE
This indicator will automatically plot the chosen moving averages (MAs) on your chart, allowing you to visually assess the trend direction. Additionally, a table displaying the trend data for each selected MA timeframe is included to provide a quick overview.
█ FEATURES
1. Customizable Moving Averages: The indicator supports various types of moving averages, including Simple (SMA), Exponential (EMA), Smoothed (RMA), Weighted (WMA), and Volume-Weighted (VWMA). You can select the type and length for each MA.
2. Multiple Timeframes: Plot moving averages for different timeframes on a single chart, including fast (short-term), mid (medium-term), and slow (long-term) MAs.
3. Trend Detector Table: A customizable table displays the trend direction (Up or Down) for each selected MA timeframe, providing a quick and easy way to assess the market's overall trend.
4. Customizable Appearance: Adjust the colors, frame, border, and text of the Trend Detector Table to match your chart's style and preferences.
5. Wait for Timeframe Close: Option to wait until the selected timeframe closes to plot the MA, which will remove the gaps.
█ CONCLUSION
The Trend Detector indicator is a versatile and user-friendly tool designed to enhance your trading strategy. By providing a clear visualization of market trends across multiple timeframes, this indicator helps you make informed trading decisions with confidence and trade with the market trend. Whether you're a day trader or a long-term investor, this indicator is an essential addition to your trading toolkit.
█ IMPORTANT
This indicator is a tool to aid in your analysis and should not be used as the sole basis for trading decisions. It is recommended to use this indicator in conjunction with other tools and perform comprehensive market analysis before making any trades.
Happy trading!
Skrypt open-source
W zgodzie z duchem TradingView twórca tego skryptu udostępnił go jako open-source, aby użytkownicy mogli przejrzeć i zweryfikować jego działanie. Ukłony dla autora. Korzystanie jest bezpłatne, jednak ponowna publikacja kodu podlega naszym Zasadom serwisu.
Wyłączenie odpowiedzialności
Informacje i publikacje nie stanowią i nie powinny być traktowane jako porady finansowe, inwestycyjne, tradingowe ani jakiekolwiek inne rekomendacje dostarczane lub zatwierdzone przez TradingView. Więcej informacji znajduje się w Warunkach użytkowania.