OPEN-SOURCE SCRIPT
Dumb Indicator 21 - Function's Candlestick Bar's Style
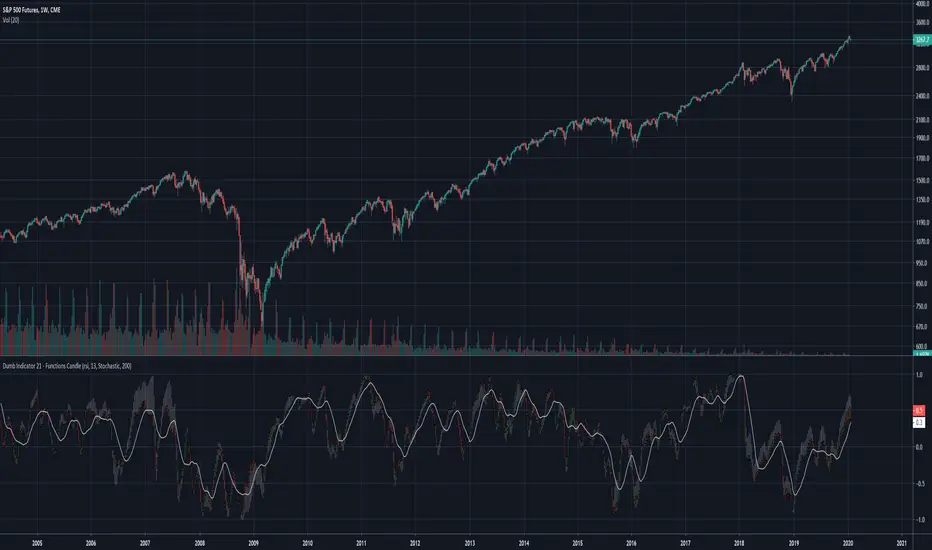
The idea is help traders to see the patterns and levels from a different point o view.
This script create candlestick using the opening, high, low and close price as source on your favorite function.
It's very simple to use:
Select a function in the drop box list, the number of bars length, check or uncheck the boxes to treat source as logarithm, smooth, and if you want to plot the SMA from the results.
To make a deeper analysis, you can select to plot the candles in Stochastic or in Percent Rank way.
The Stochastic and Percent Rank plot will show how far the price is close to highest or lowest value of the source from the last "Stochastic Length" number of bars.
Some functions with different names can plot the same results.
This indicator works on every kind of market, but you will need to find the best function and length to use.
Please, if you find anything good with this, share to everyone.
Skrypt open-source
W zgodzie z duchem TradingView twórca tego skryptu udostępnił go jako open-source, aby użytkownicy mogli przejrzeć i zweryfikować jego działanie. Ukłony dla autora. Korzystanie jest bezpłatne, jednak ponowna publikacja kodu podlega naszym Zasadom serwisu.
Feel free to share your success with me: 🤑👍
BTC - bc1qq23w655arvclce7u8zkt4lag08fnctgccs9s9s
ETH - 0xf6cf166Ea5EC550372e179dB1AF579a29Cb91dDf
USDT - 0x8DbC0E889Afb3bec7241eD0E42429A612aa30015 - (ERC20)
BTC - bc1qq23w655arvclce7u8zkt4lag08fnctgccs9s9s
ETH - 0xf6cf166Ea5EC550372e179dB1AF579a29Cb91dDf
USDT - 0x8DbC0E889Afb3bec7241eD0E42429A612aa30015 - (ERC20)
Wyłączenie odpowiedzialności
Informacje i publikacje nie stanowią i nie powinny być traktowane jako porady finansowe, inwestycyjne, tradingowe ani jakiekolwiek inne rekomendacje dostarczane lub zatwierdzone przez TradingView. Więcej informacji znajduje się w Warunkach użytkowania.