OPEN-SOURCE SCRIPT
Zaktualizowano Volume Weighted Regression Channel
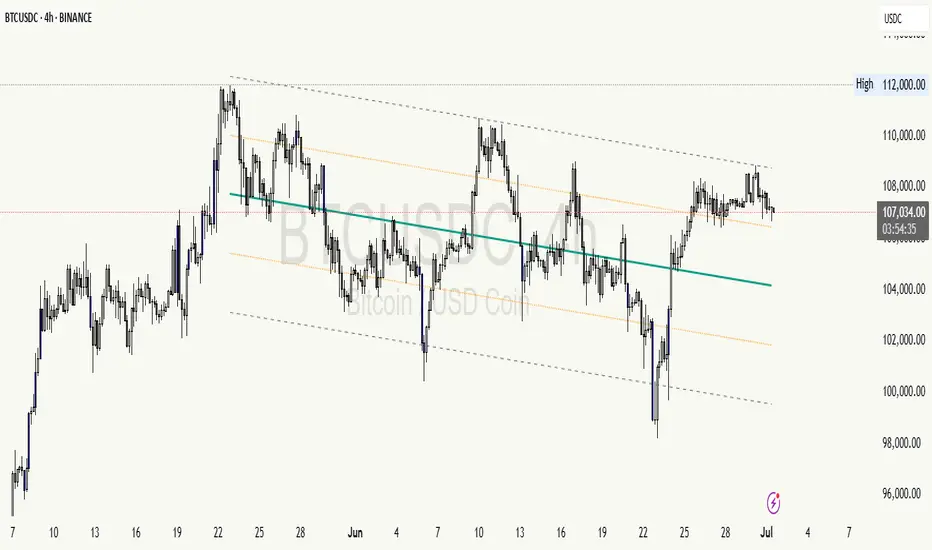
This indicator constructs a volume-weighted linear regression channel over a custom time range.
It’s conceptually similar to a Volume Profile, but instead of projecting horizontal value zones, it builds a tilted trend channel that reflects both price direction and volume concentration.
🧠 Core Features:
Volume-weighted points: Each candle contributes to the regression line proportionally to its volume — heavier candles shift the channel toward high-activity price zones.
Linear regression line: Shows the trend direction within the selected time interval.
±σ boundaries: Outer bands represent the standard deviation of price (also volume-weighted), highlighting statistical dispersion.
Fully customizable: Adjustable line styles, widths, and channel width (sigma multiplier).
Time window control: Select any start and end time to define the regression interval.
📊 Why use this instead of Volume Profile?
While Volume Profile shows horizontal distributions of traded volume, this indicator is ideal when:
You want to understand how volume clusters affect trend direction, not just price levels.
You're analyzing time-dependent flow rather than static price zones.
You're looking for a dynamic volume-adjusted channel that moves with the market's structure.
It’s especially useful in identifying volume-supported trends, hidden pullback zones, and statistical extremes.
⚙️ Notes:
Works on any timeframe and instrument.
Does not repaint.
Does not require volume profile data feeds — uses standard volume and hl2.
Informacje o Wersji
🔄 Update: Dual Sigma Boundaries for Volume Weighted Regression ChannelWe’ve added support for a second channel boundary to the Volume Weighted Regression Channel indicator!
📌 What’s new:
Now you can enable two separate sigma levels to be displayed at the same time.
For example, visualize both the 1-sigma and 2-sigma boundaries simultaneously.
Each boundary has independent style and color settings for enhanced visual control.
🎯 Why it matters:
This update allows traders to better identify price extremes and dynamic support/resistance zones within a statistically significant volume-weighted trend channel.
🛠️ Example use cases:
1σ for typical price fluctuation
2σ for rare/overextended moves
Skrypt open-source
W zgodzie z duchem TradingView twórca tego skryptu udostępnił go jako open-source, aby użytkownicy mogli przejrzeć i zweryfikować jego działanie. Ukłony dla autora. Korzystanie jest bezpłatne, jednak ponowna publikacja kodu podlega naszym Zasadom serwisu.
Wyłączenie odpowiedzialności
Informacje i publikacje nie stanowią i nie powinny być traktowane jako porady finansowe, inwestycyjne, tradingowe ani jakiekolwiek inne rekomendacje dostarczane lub zatwierdzone przez TradingView. Więcej informacji znajduje się w Warunkach użytkowania.