OPEN-SOURCE SCRIPT
Zaktualizowano Multi-Timeframe Trend Cloud (EMA13/21) with Alerts

Purpose:
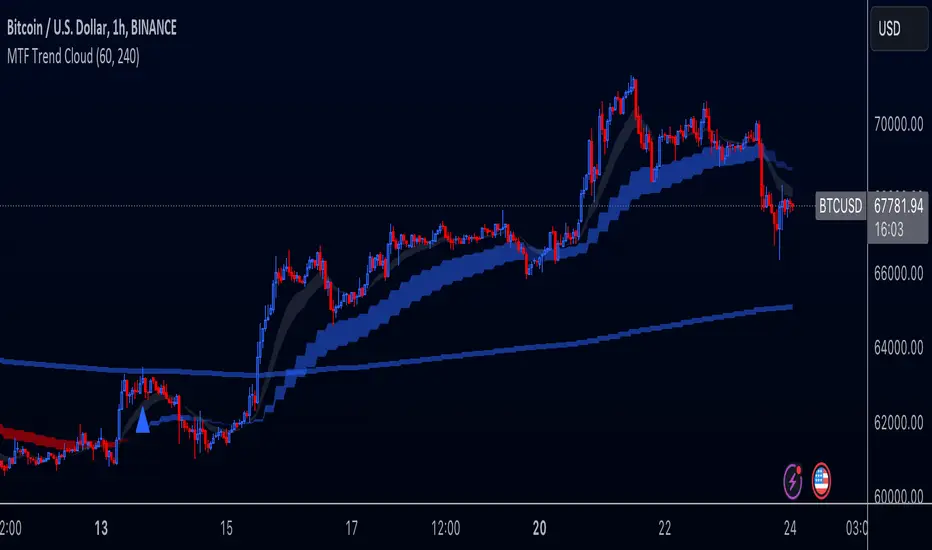
This indicator combines trend analysis across multiple timeframes with alerts to help identify general trends and market shifts. It visualizes trends by creating EMA clouds (The area between EMA13 & EMA21), detects confirmed EMA crossovers, and can alert users when the price re-enters the cloud or interacts with the EMA200.
Input Parameters:
Calculating & Plotting EMAs:
Identifying Trend States:
The script uses the relationships between the price and the 13-period and 21-period EMAs on the Higher Time Frame (HTF) to identify four distinct trend states, each depicted by a specific color to create the "Trend Cloud":
Confirmed Crossover Signals:
The indicator plots upward or downward triangles to signal confirmed crossovers of the EMA13 and EMA21 on the HTF. A crossover is considered "confirmed" when it's followed by a candle closing on the same side of the crossing point, adding an extra layer of confidence to the signal.
Cloud Re-entry Alerts:
Receive alerts whenever the price re-enters the HTF cloud - aka "Trend".
EMA200 Retest Alerts:
Get alerts when the price touches the 200 EMA on the HTF. These alerts can be valuable for identifying potential trend reversals or trend continuation scenarios.
Benefits:
How to Use:
Note: This indicator is a great tool for trend analysis, but it should be used with other forms of analysis and risk management techniques to make informed trading decisions.
This indicator combines trend analysis across multiple timeframes with alerts to help identify general trends and market shifts. It visualizes trends by creating EMA clouds (The area between EMA13 & EMA21), detects confirmed EMA crossovers, and can alert users when the price re-enters the cloud or interacts with the EMA200.
Input Parameters:
- Lower Timeframe (LTF): Allows you to select the lower timeframe for trend analysis (e.g., 1 hour, 4 hours).
- Higher Timeframe (HTF): Allows you to select the higher timeframe for the main trend reference (e.g., 4 hours, 1 day).
- Fill Colors: You can customize the colors used to fill the areas between the EMA lines in both the higher and lower timeframes. Note: The LTF cloud defaults to transparent white so if you have a light background change the color in style settings.
- The EMA's default to transparent but can be turned on in the style settings.
Calculating & Plotting EMAs:
- The indicator calculates two Exponential Moving Averages (EMAs) on both the LTF and HTF: a faster 13-period EMA and a slower 21-period EMA.
- Additionally, it calculates a 200-period EMA on the HTF.
- These EMAs are plotted on your chart, providing a visual representation of the trend.
Identifying Trend States:
The script uses the relationships between the price and the 13-period and 21-period EMAs on the Higher Time Frame (HTF) to identify four distinct trend states, each depicted by a specific color to create the "Trend Cloud":
- Strong Bull Trend: The 13-period EMA is above the 21-period EMA, and the price is above both EMAs. --- "Color 0" in HTF Trend style settings.
- Broken Bullish Trend: The 13-period EMA is above the 21-period EMA but price has broken below both EMA's. --- "Color 3" in HTF Trend style settings.
- Strong Bear Trend: The 13-period EMA is below the 21-period EMA, and the price is below both EMAs. --- "Color 2" in HTF Trend style settings.
- Broken Bearish Trend: The 13-period EMA is below the 21-period EMA but price has broken above both EMA's. --- "Color 1" in HTF Trend style settings.
- Important Note: The 200-period EMA is plotted for reference but is not directly used in determining the current trend state within this script.
Confirmed Crossover Signals:
The indicator plots upward or downward triangles to signal confirmed crossovers of the EMA13 and EMA21 on the HTF. A crossover is considered "confirmed" when it's followed by a candle closing on the same side of the crossing point, adding an extra layer of confidence to the signal.
Cloud Re-entry Alerts:
Receive alerts whenever the price re-enters the HTF cloud - aka "Trend".
EMA200 Retest Alerts:
Get alerts when the price touches the 200 EMA on the HTF. These alerts can be valuable for identifying potential trend reversals or trend continuation scenarios.
Benefits:
- Clear Visual Representation: Easily visualize trends on both the lower and higher timeframes.
- Confirmed Signals: Filter out false signals by focusing on confirmed crossovers.
- Timely Alerts: Get instant notifications for important price actions, allowing you to react quickly to market opportunities.
- Customizable: Tailor the indicator's appearance and alert settings to your preferences.
How to Use:
- Add the indicator to your chart.
- Select your desired LTF and HTF in the Inputs tab.
- Customize the fill colors (and optional EMA line colors) in the Style tab.
- Enable the alerts you want to receive in the Alerts tab.
Note: This indicator is a great tool for trend analysis, but it should be used with other forms of analysis and risk management techniques to make informed trading decisions.
Informacje o Wersji
Mini Update: Added input option to choose EMA21 or EMA25 for the Long EMA of the trend cloud. Skrypt open-source
W zgodzie z duchem TradingView twórca tego skryptu udostępnił go jako open-source, aby użytkownicy mogli przejrzeć i zweryfikować jego działanie. Ukłony dla autora. Korzystanie jest bezpłatne, jednak ponowna publikacja kodu podlega naszym Zasadom serwisu.
Wyłączenie odpowiedzialności
Informacje i publikacje nie stanowią i nie powinny być traktowane jako porady finansowe, inwestycyjne, tradingowe ani jakiekolwiek inne rekomendacje dostarczane lub zatwierdzone przez TradingView. Więcej informacji znajduje się w Warunkach użytkowania.
Skrypt open-source
W zgodzie z duchem TradingView twórca tego skryptu udostępnił go jako open-source, aby użytkownicy mogli przejrzeć i zweryfikować jego działanie. Ukłony dla autora. Korzystanie jest bezpłatne, jednak ponowna publikacja kodu podlega naszym Zasadom serwisu.
Wyłączenie odpowiedzialności
Informacje i publikacje nie stanowią i nie powinny być traktowane jako porady finansowe, inwestycyjne, tradingowe ani jakiekolwiek inne rekomendacje dostarczane lub zatwierdzone przez TradingView. Więcej informacji znajduje się w Warunkach użytkowania.