PROTECTED SOURCE SCRIPT
RSI + Volume-Weighted TSI
This indicator combines a standard RSI with a modified TSI.
Although a double smoothing process is already used in calculating the normal TSI, we decided to apply a volume weighted moving average of length (length_of_slow_TSI_EMA // 2) to it. This resulted in a smoother TSI that picked up on large-scale swings very nicely.
Entry Signals are generated when the Volume-Weighted TSI crosses above zero from negative into positive territory. Exit signals are generated when the TSI is above 40 and then begins its downward fall, along with a declining RSI value.
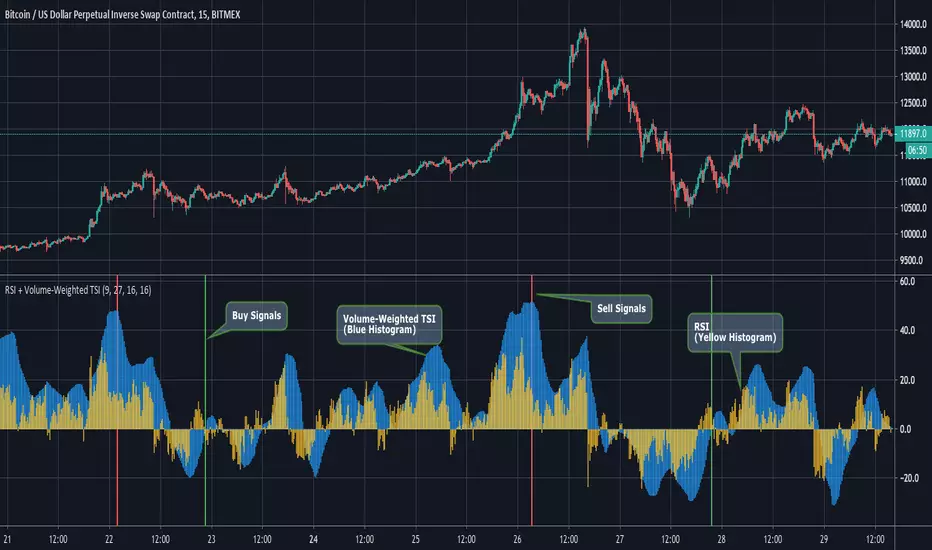
The Graph:
The Volume-Weighted TSI is plotted as the blue histogram, wile the RSI is plotted as the yellow histogram. We definitely wanted to go the simplicity route on this one's graphics, since the RSI and TSI are both classic and reliable indicators.
The green background highlights indicate an entry signal and red highlights signify an exit signal.
Input Options:
-length of Slow EMA for TSI
-length of Fast EMA for TSI
-Length of Volume Weighted MA of TSI.
-Length of RSI.
~Happy Trading~
Although a double smoothing process is already used in calculating the normal TSI, we decided to apply a volume weighted moving average of length (length_of_slow_TSI_EMA // 2) to it. This resulted in a smoother TSI that picked up on large-scale swings very nicely.
Entry Signals are generated when the Volume-Weighted TSI crosses above zero from negative into positive territory. Exit signals are generated when the TSI is above 40 and then begins its downward fall, along with a declining RSI value.
The Graph:
The Volume-Weighted TSI is plotted as the blue histogram, wile the RSI is plotted as the yellow histogram. We definitely wanted to go the simplicity route on this one's graphics, since the RSI and TSI are both classic and reliable indicators.
The green background highlights indicate an entry signal and red highlights signify an exit signal.
Input Options:
-length of Slow EMA for TSI
-length of Fast EMA for TSI
-Length of Volume Weighted MA of TSI.
-Length of RSI.
~Happy Trading~
Skrypt chroniony
Ten skrypt został opublikowany jako zamknięty kod źródłowy. Można z tego korzystać swobodnie i bez żadnych ograniczeń — więcej informacji znajduje się tutaj.
-Profit Programmers
profitprogrammer.com
profitprogrammer.com
Wyłączenie odpowiedzialności
Informacje i publikacje nie stanowią i nie powinny być traktowane jako porady finansowe, inwestycyjne, tradingowe ani jakiekolwiek inne rekomendacje dostarczane lub zatwierdzone przez TradingView. Więcej informacji znajduje się w Warunkach użytkowania.