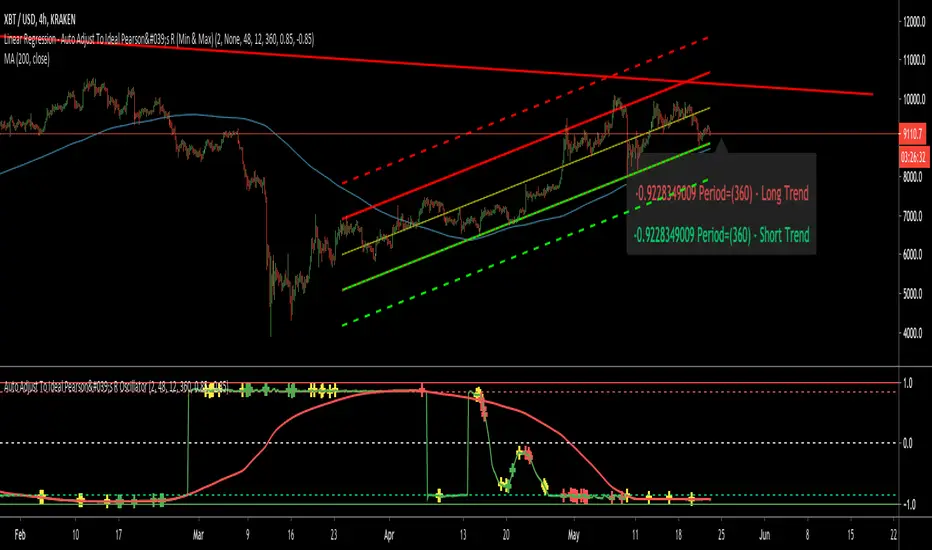
This is meant to be a partner indicator to "Linear Regression - Auto Adjust To Ideal Pearson's R (Min & Max)" which can be found under my profile on the scripts I have made.
It's important the the ideal Pearsons R + and - ideal ranges are the same as the other script so you can visualize the results better and what is going on. I set them to default to 0.85 for strong confidence levels.
This simply graphs what the Pearsons's R Long Term Trend (Red) and Short Term Trend (Green) are doing. I noticed that they tend to oscillate in predictable ways.
The white line signifies low confidence level in a trend and usually means there is sideways trading going on.
If you are unfamiliar with Pearson's R then below will help:
For this reason I colored the bottom lines 'green' to indicate buying zones and 'red' for the top lines to indicate potential shorting zones.
If you look at this indicator in replay mode in tandem with my other indicator you will see they work well together to help you identify long term trends.
The default values are 48 and 360 for the minimum allowed length of a trend and maximum length. If you find the script is to slow you can change these but make sure you do it for the values on the other script as well so they line up.
As always the code is open source.
It's important the the ideal Pearsons R + and - ideal ranges are the same as the other script so you can visualize the results better and what is going on. I set them to default to 0.85 for strong confidence levels.
This simply graphs what the Pearsons's R Long Term Trend (Red) and Short Term Trend (Green) are doing. I noticed that they tend to oscillate in predictable ways.
The white line signifies low confidence level in a trend and usually means there is sideways trading going on.
If you are unfamiliar with Pearson's R then below will help:
- + Pearsons R means there is a downtrend
- - Pearsons R means there is an uptrend
- The closer the value is to 1 the more sure it's a downtrend.
- The closer the value is to -1 the more sure it's an uptrend.
For this reason I colored the bottom lines 'green' to indicate buying zones and 'red' for the top lines to indicate potential shorting zones.
If you look at this indicator in replay mode in tandem with my other indicator you will see they work well together to help you identify long term trends.
The default values are 48 and 360 for the minimum allowed length of a trend and maximum length. If you find the script is to slow you can change these but make sure you do it for the values on the other script as well so they line up.
As always the code is open source.
Informacje o Wersji
I added markers that you can optionally turn off/on to show when the midline, upperline, or lowerline crosses occur. This is extremely useful because if the trend is very strong near the top levels 0.8 or -0.8 for example and you start seeing red or green crosses be ready for a reversal very quickly.If the crosses are annoying you can turn them off in the settings. Hope you guys like this update.
Skrypt open-source
W zgodzie z duchem TradingView twórca tego skryptu udostępnił go jako open-source, aby użytkownicy mogli przejrzeć i zweryfikować jego działanie. Ukłony dla autora. Korzystanie jest bezpłatne, jednak ponowna publikacja kodu podlega naszym Zasadom serwisu.
-=Gentleman Goat=- Download the TradingView Input Optimizer at tradingtools.software/optimizer
Discord: discord.gg/pGHHRczpbu
Discord: discord.gg/pGHHRczpbu
Wyłączenie odpowiedzialności
Informacje i publikacje nie stanowią i nie powinny być traktowane jako porady finansowe, inwestycyjne, tradingowe ani jakiekolwiek inne rekomendacje dostarczane lub zatwierdzone przez TradingView. Więcej informacji znajduje się w Warunkach użytkowania.
