OPEN-SOURCE SCRIPT
Support and Resistance Levels and Zones [Quantigenics]

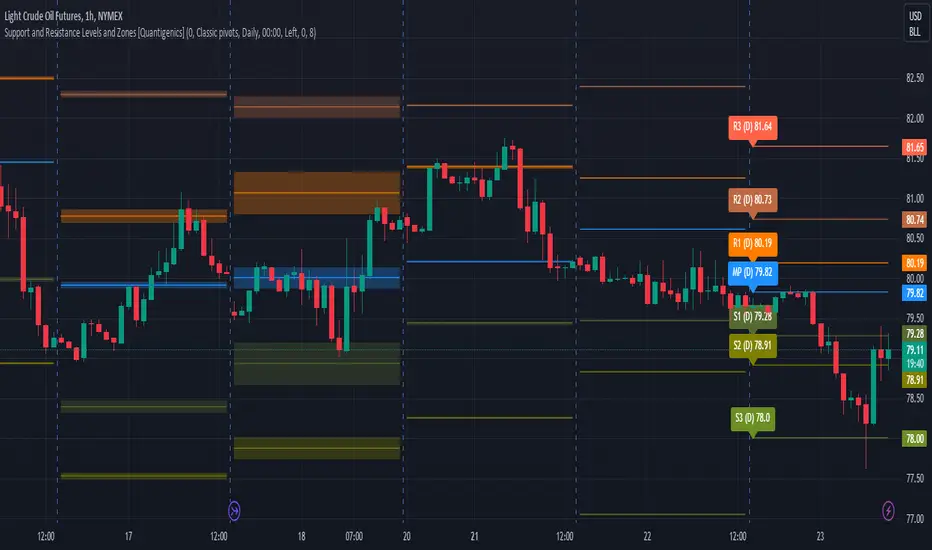
Support and Resistance Levels and Zones Indicator is an enhanced support and resistance indicator in that typical support and resistance levels are crucial concepts in technical analysis representing price levels where selling or buying momentum tends to halt, typically leading to a price reversal.
The Support and Resistance Levels and Zones Indicator goes beyond static levels by identifying dynamic 'zones'. These zones, depicted as shaded areas, offer more nuanced insights, acknowledging that markets are not rigid but fluctuating entities. Traders can leverage these zones, alongside the standard levels that the indicator plots, to better time their entries and exits, maximizing potential profitability and minimizing risk.
This is a "must-see on your charts" indicator and while scrolling back looking at historical data shows the amazing power of this indicator, it's even better in realtime LIVE price action and the price can tend to hit the Support and Resistance Levels and Zones multiple times intrabar.
 GOLD 1HR

 CL1! 15MIN

Enjoy!
The Support and Resistance Levels and Zones Indicator goes beyond static levels by identifying dynamic 'zones'. These zones, depicted as shaded areas, offer more nuanced insights, acknowledging that markets are not rigid but fluctuating entities. Traders can leverage these zones, alongside the standard levels that the indicator plots, to better time their entries and exits, maximizing potential profitability and minimizing risk.
This is a "must-see on your charts" indicator and while scrolling back looking at historical data shows the amazing power of this indicator, it's even better in realtime LIVE price action and the price can tend to hit the Support and Resistance Levels and Zones multiple times intrabar.
Enjoy!
Skrypt open-source
W zgodzie z duchem TradingView twórca tego skryptu udostępnił go jako open-source, aby użytkownicy mogli przejrzeć i zweryfikować jego działanie. Ukłony dla autora. Korzystanie jest bezpłatne, jednak ponowna publikacja kodu podlega naszym Zasadom serwisu.
Quantigenics Premium Indicator Suite
Visit quantigenics.com to subscribe
E-mail us at support@quantigenics.com
Happy Trading!
Visit quantigenics.com to subscribe
E-mail us at support@quantigenics.com
Happy Trading!
Wyłączenie odpowiedzialności
Informacje i publikacje nie stanowią i nie powinny być traktowane jako porady finansowe, inwestycyjne, tradingowe ani jakiekolwiek inne rekomendacje dostarczane lub zatwierdzone przez TradingView. Więcej informacji znajduje się w Warunkach użytkowania.