PROTECTED SOURCE SCRIPT
FibroTrend Matrix Premium [By TraderMan]
📊 FibroTrend Matrix Premium [By TraderMan]
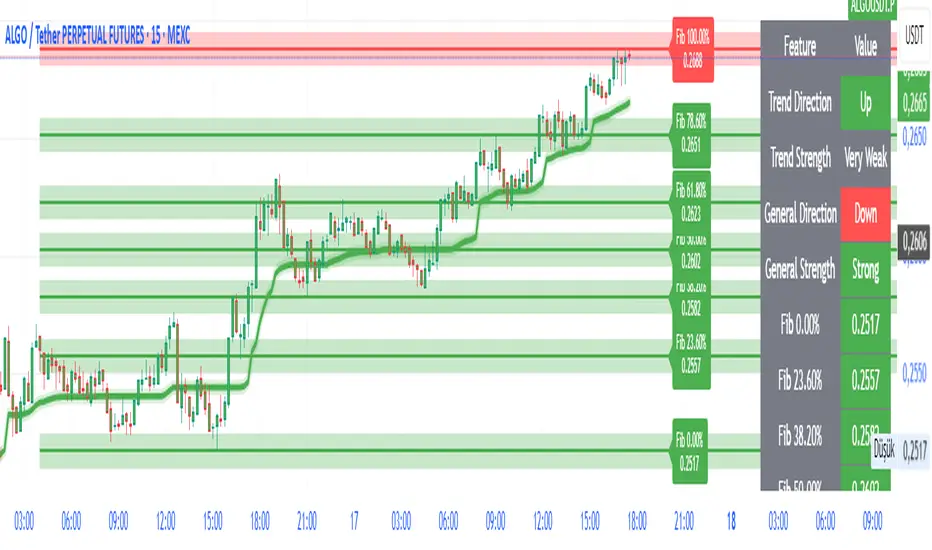
FibroTrend Matrix Premium is a powerful multi-timeframe trend and Fibonacci analysis tool. It combines trend direction, trend strength, and key Fibonacci levels into a single, clean interface with a dynamic table. Perfect for traders who want to see the market structure at a glance.
🧠 How It Works
Trend Detection 📈📉
Uses EMA-based dynamic bands to determine current trend direction.
Computes trend strength using slope of the trend line vs. price deviation.
Works on multiple timeframes (5m, 15m, 30m, 1h, 4h, 1D) for overall market context.
Fibonacci Levels & Zones 🔢
Automatically draws key Fibonacci retracement levels (0, 0.236, 0.382, 0.5, 0.618, 0.786, 1.0).
Adds zones around levels for potential support/resistance areas.
Labels are small and clear, lines slightly thicker for better visibility.
Trend Table Summary 📊
Shows current trend direction, strength, and general trend across multiple timeframes.
Fibonacci levels are included in the table with color-coded cells (green = bullish, red = bearish).
⚡ How to Use / Trading Logic
Identify Trend Direction
Uptrend (Green/“Up”) → look for buying opportunities.
Downtrend (Red/“Down”) → look for selling/shorting opportunities.
Neutral → wait or stay out.
Check Trend Strength
Very Strong / Strong (Green) → trend likely to continue.
Weak / Very Weak (Red) → trend may reverse or be choppy.
Use Fibonacci Levels for Entry & Exit
Enter near support zones in an uptrend.
Enter near resistance zones in a downtrend.
Use zone width & tolerance to set stop-loss or take-profit.
Multi-Timeframe Confirmation ✅
Ensure majority of timeframes confirm trend direction for stronger signal.
Example: if 5 out of 6 timeframes show Uptrend, trend is strong.
💡 Tips
Combine with volume, momentum, or RSI for extra confirmation.
Avoid trading solely on Fibonacci levels; use trend + strength table as main guide.
Works well for swing trading, intraday, and crypto markets.
🎯 Entry Example
Price is in an uptrend (green bars, line up).
Fibonacci retracement 0.382 aligns with support zone.
Trend strength = Strong or Very Strong.
Enter Long near zone, set stop-loss slightly below zone, take-profit near next Fibonacci level.
Skrypt chroniony
Ten skrypt został opublikowany jako zamknięty kod źródłowy. Można z tego korzystać swobodnie i bez żadnych ograniczeń — więcej informacji znajduje się tutaj.
Wyłączenie odpowiedzialności
Informacje i publikacje nie stanowią i nie powinny być traktowane jako porady finansowe, inwestycyjne, tradingowe ani jakiekolwiek inne rekomendacje dostarczane lub zatwierdzone przez TradingView. Więcej informacji znajduje się w Warunkach użytkowania.