OPEN-SOURCE SCRIPT
Zaktualizowano Normalized Fisher Transformed Volume
Greetings Traders,
I am thrilled to introduce a game-changing tool that I've passionately developed to enhance your trading precision – the Normalized Fisher Transformed Volume indicator. Let's dive into the specifics and explore how this tool can empower you in the markets.
Unlocking Trading Precision:
Normalization and Transformation:
Normalize raw volume data to ensure a consistent scale for analysis.
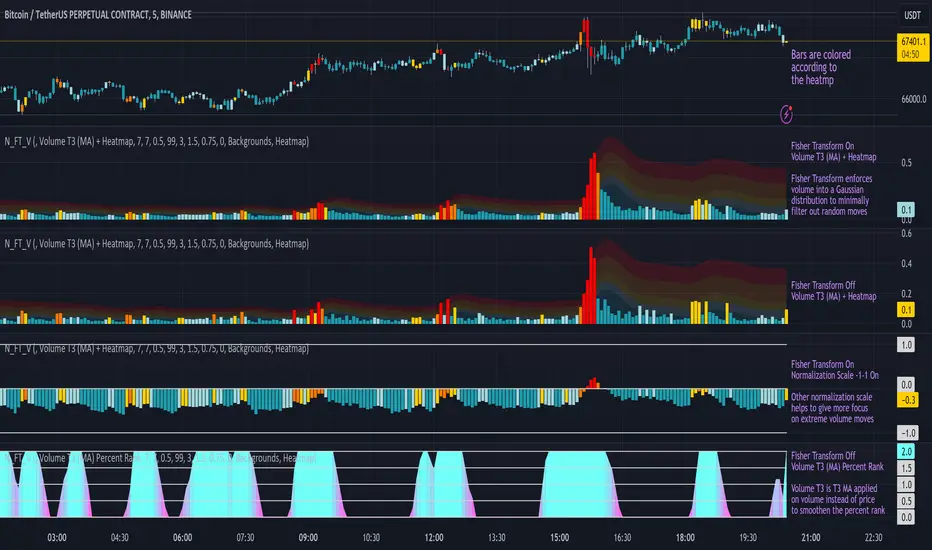
The Fisher Transformation converts normalized volume data into a Gaussian distribution, providing enhanced insights into trend dynamics.
Flexible Modes for Tailored Strategies:
Choose from three distinct modes:
Heatmap Visualization for Quick Insights:
Heatmap Zones and Lines visually represent volume strength relative to historical data.
Customize threshold multipliers and color options for precise Heatmap interpretation.
T3 Moving Average Integration:
Smoothed representation of volume trends with the T3 Moving Average enhances trend identification.
Percent Rank Analysis for Context:
Gauge the position of normalized volume within historical context using Percent Rank analysis.
User-Friendly Customization:
Easily adjust parameters such as length, T3 Moving Average length, Heatmap standard deviation length, and threshold multipliers.
Intuitive interface with colored bars and customizable background options for personalized analysis.
How to Use Effectively:
Mode Selection:
Identify your preferred trading strategy and select the mode that aligns with your approach.
Parameter Adjustment:
Fine-tune the indicator by adjusting parameters to match your preferred trading style.
Interpret Heatmap and T3 Analysis:
Leverage Heatmap and T3 Moving Average analysis to spot potential trend reversals, overbought/oversold conditions, and market sentiment shifts.
Conclusion:
The Normalized Fisher Transformed Volume indicator is not just a tool; it's your key to unlocking precision in trading. Crafted by Simwai, this indicator offers unique insights tailored to your specific trading needs. Dive in, explore its features, experiment with parameters, and let it guide you to more informed and precise trading decisions.
Trade wisely and prosper,
simwai
I am thrilled to introduce a game-changing tool that I've passionately developed to enhance your trading precision – the Normalized Fisher Transformed Volume indicator. Let's dive into the specifics and explore how this tool can empower you in the markets.
Unlocking Trading Precision:
Normalization and Transformation:
Normalize raw volume data to ensure a consistent scale for analysis.
The Fisher Transformation converts normalized volume data into a Gaussian distribution, providing enhanced insights into trend dynamics.
Flexible Modes for Tailored Strategies:
Choose from three distinct modes:
- Volume T3 (MA) + Heatmap: Identify trends with T3 Moving Average and visualize volume strength with Heatmap.
- Volume Percent Rank: Evaluate the position of current volume relative to historical data.
- Volume T3 (MA) Percent Rank: Combine T3 Moving Average with percentile ranking for a comprehensive analysis.
Heatmap Visualization for Quick Insights:
Heatmap Zones and Lines visually represent volume strength relative to historical data.
Customize threshold multipliers and color options for precise Heatmap interpretation.
T3 Moving Average Integration:
Smoothed representation of volume trends with the T3 Moving Average enhances trend identification.
Percent Rank Analysis for Context:
Gauge the position of normalized volume within historical context using Percent Rank analysis.
User-Friendly Customization:
Easily adjust parameters such as length, T3 Moving Average length, Heatmap standard deviation length, and threshold multipliers.
Intuitive interface with colored bars and customizable background options for personalized analysis.
How to Use Effectively:
Mode Selection:
Identify your preferred trading strategy and select the mode that aligns with your approach.
Parameter Adjustment:
Fine-tune the indicator by adjusting parameters to match your preferred trading style.
Interpret Heatmap and T3 Analysis:
Leverage Heatmap and T3 Moving Average analysis to spot potential trend reversals, overbought/oversold conditions, and market sentiment shifts.
Conclusion:
The Normalized Fisher Transformed Volume indicator is not just a tool; it's your key to unlocking precision in trading. Crafted by Simwai, this indicator offers unique insights tailored to your specific trading needs. Dive in, explore its features, experiment with parameters, and let it guide you to more informed and precise trading decisions.
Trade wisely and prosper,
simwai
Informacje o Wersji
Removed superfluous plot linesInformacje o Wersji
Fixed timeframe selection bug where timeframe didn't get applied.Informacje o Wersji
Fixed wrong normalization calculationInformacje o Wersji
Removed unused functionInformacje o Wersji
Fixed bug where Fisher Transform wasn't applied to the heatmap Added more description to the screenshot, because the description I made is really bad, but I cannot change it...
Informacje o Wersji
Updated screenshotInformacje o Wersji
Fixed that changing the timeframe didn't work.Skrypt open-source
W zgodzie z duchem TradingView twórca tego skryptu udostępnił go jako open-source, aby użytkownicy mogli przejrzeć i zweryfikować jego działanie. Ukłony dla autora. Korzystanie jest bezpłatne, jednak ponowna publikacja kodu podlega naszym Zasadom serwisu.
Wyłączenie odpowiedzialności
Informacje i publikacje nie stanowią i nie powinny być traktowane jako porady finansowe, inwestycyjne, tradingowe ani jakiekolwiek inne rekomendacje dostarczane lub zatwierdzone przez TradingView. Więcej informacji znajduje się w Warunkach użytkowania.
Skrypt open-source
W zgodzie z duchem TradingView twórca tego skryptu udostępnił go jako open-source, aby użytkownicy mogli przejrzeć i zweryfikować jego działanie. Ukłony dla autora. Korzystanie jest bezpłatne, jednak ponowna publikacja kodu podlega naszym Zasadom serwisu.
Wyłączenie odpowiedzialności
Informacje i publikacje nie stanowią i nie powinny być traktowane jako porady finansowe, inwestycyjne, tradingowe ani jakiekolwiek inne rekomendacje dostarczane lub zatwierdzone przez TradingView. Więcej informacji znajduje się w Warunkach użytkowania.