OPEN-SOURCE SCRIPT
Zaktualizowano Irrationality Index by CRYPTO_ADA_BTC
"The market can be irrational longer than you can stay solvent" ~ John Maynard Keynes
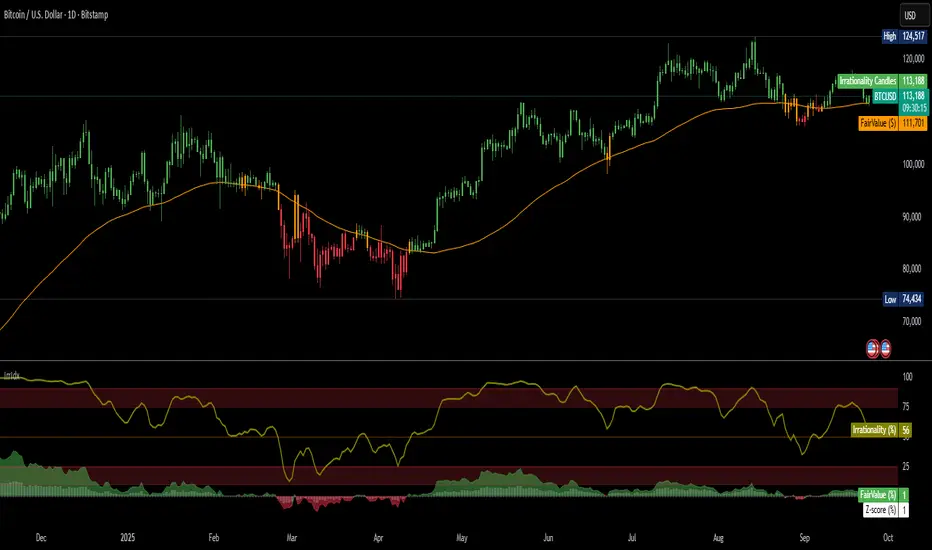
This indicator, the Irrationality Index, measures how far the current market price has deviated from a smoothed estimate of its "fair value," normalized for recent volatility. It provides traders with a visual sense of when the market may be behaving irrationally, without giving direct buy or sell signals.
How it works:
1. Fair Value Calculation
The indicator estimates a "fair value" for the asset using a combination of a long-term EMA (exponential moving average) and a linear regression trend over a configurable period. This fair value serves as a smoothed baseline for price, balancing trend-following and mean-reversion.
2. Volatility-Adjusted Z-Score
The deviation between price and fair value is measured in standard deviations of recent log returns:
Pine Script®
This standardization accounts for different volatility environments, allowing comparison across assets.
3. Irrationality Score (0–100)
The Z-score is transformed using a logistic mapping into a 0–100 scale:
- 50 → price near fair value (rational zone)
- >75 → high irrationality, price stretched above fair value
- >90 → extreme irrationality, unsustainable extremes
- <25 → high irrationality, price stretched below fair value
- <10 → extreme bearish irrationality
4. Price vs Fair Value (% deviation)
The indicator plots the percentage difference between price and fair value:
Pine Script®
- Positive values → Percentage above fair value (optimistic / overvalued)
- Negative values → Percentage below fair value (pessimistic / undervalued)
Visuals:
- Irrationality (%) Line (0–100) shows irrationality level.
- Background Colors: Yellow= high bullish irrationality, Green= extreme bullish irrationality, Orange= high bearish irrationality, Red= extreme bearish irrationality.
- Price - FairValue (%) plot: price deviation vs fair value (%), Colored green above 0 and red below 0.
- Label: display actual price, estimated fair value, and Z-score for the latest bar.
- Alerts: configurable thresholds for high and extreme irrationality.
How to read it:
- 50 → Market trading near fair value.
- >75 / >90 → Price may be irrationally high; risk of pullback increases.
- <25 / <10 → Price may be irrationally low; potential rebound zones, but trends can continue.
- Price - FairValue (%) plot → visual guide for % price stretch relative to fair value.
Notes / Warnings:
- Measures relative deviation, not fundamental value!
- High irrationality scores do not automatically indicate trades; markets can remain can be irrational longer than you can stay solvent.
- Best used with other tools: momentum, volume, divergence, and multi-timeframe analysis.
This indicator, the Irrationality Index, measures how far the current market price has deviated from a smoothed estimate of its "fair value," normalized for recent volatility. It provides traders with a visual sense of when the market may be behaving irrationally, without giving direct buy or sell signals.
How it works:
1. Fair Value Calculation
The indicator estimates a "fair value" for the asset using a combination of a long-term EMA (exponential moving average) and a linear regression trend over a configurable period. This fair value serves as a smoothed baseline for price, balancing trend-following and mean-reversion.
2. Volatility-Adjusted Z-Score
The deviation between price and fair value is measured in standard deviations of recent log returns:
Z = (log(price) - log(fairValue)) / volatility
This standardization accounts for different volatility environments, allowing comparison across assets.
3. Irrationality Score (0–100)
The Z-score is transformed using a logistic mapping into a 0–100 scale:
- 50 → price near fair value (rational zone)
- >75 → high irrationality, price stretched above fair value
- >90 → extreme irrationality, unsustainable extremes
- <25 → high irrationality, price stretched below fair value
- <10 → extreme bearish irrationality
4. Price vs Fair Value (% deviation)
The indicator plots the percentage difference between price and fair value:
pctDiff = (price - fairValue) / fairValue * 100
- Positive values → Percentage above fair value (optimistic / overvalued)
- Negative values → Percentage below fair value (pessimistic / undervalued)
Visuals:
- Irrationality (%) Line (0–100) shows irrationality level.
- Background Colors: Yellow= high bullish irrationality, Green= extreme bullish irrationality, Orange= high bearish irrationality, Red= extreme bearish irrationality.
- Price - FairValue (%) plot: price deviation vs fair value (%), Colored green above 0 and red below 0.
- Label: display actual price, estimated fair value, and Z-score for the latest bar.
- Alerts: configurable thresholds for high and extreme irrationality.
How to read it:
- 50 → Market trading near fair value.
- >75 / >90 → Price may be irrationally high; risk of pullback increases.
- <25 / <10 → Price may be irrationally low; potential rebound zones, but trends can continue.
- Price - FairValue (%) plot → visual guide for % price stretch relative to fair value.
Notes / Warnings:
- Measures relative deviation, not fundamental value!
- High irrationality scores do not automatically indicate trades; markets can remain can be irrational longer than you can stay solvent.
- Best used with other tools: momentum, volume, divergence, and multi-timeframe analysis.
Informacje o Wersji
"The market can be irrational longer than you can stay solvent" ~ John Maynard KeynesThis indicator, the Irrationality Index, measures how far the current market price has deviated from a smoothed estimate of its "fair value," normalized for recent volatility. It provides traders with a visual sense of when the market may be behaving irrationally, without giving direct buy or sell signals.
How it works:
1. Fair Value Calculation
The indicator estimates a "fair value" for the asset using a combination of a long-term EMA (exponential moving average) and a linear regression trend over a configurable period. This fair value serves as a smoothed baseline for price, balancing trend-following and mean-reversion.
2. Volatility-Adjusted Z-Score
The deviation between price and fair value is measured in standard deviations of recent log returns:
Z = (log(price) - log(fairValue)) / volatility
This standardization accounts for different volatility environments, allowing comparison across assets.
3. Irrationality Score (0–100)
The Z-score is transformed using a logistic mapping into a 0–100 scale:
- 50 → price near fair value (rational zone)
- >75 → high irrationality, price stretched above fair value
- >90 → extreme irrationality, unsustainable extremes
- <25 → high irrationality, price stretched below fair value
- <10 → extreme bearish irrationality
4. Price vs Fair Value (% deviation)
The indicator plots the percentage difference between price and fair value:
pctDiff = (price - fairValue) / fairValue * 100
- Positive values → price above fair value (optimistic / overvalued)
- Negative values → price below fair value (pessimistic / undervalued)
Visuals:
- Irrationality Line (0–100) shows irrationality level.
- Fair Value (%) Plot: price deviation vs fair value (%), colored green above 0 and red below 0.
- Alerts: configurable thresholds for high and extreme irrationality.
How to read it:
- 50 → Market trading near fair value.
- >75 / >90 → Price may be irrationally high; risk of pullback increases.
- <25 / <10 → Price may be irrationally low; potential rebound zones, but trends can continue.
- Fair Value (%) plot → visual guide for % price stretch relative to fair value.
Notes / Warnings:
- Measures relative deviation, not fundamental value.
- High irrationality scores do not automatically indicate trades; markets can remain irrational longer than expected.
- Best used with other tools: momentum, volume, divergence, and multi-timeframe analysis.
Skrypt open-source
W zgodzie z duchem TradingView twórca tego skryptu udostępnił go jako open-source, aby użytkownicy mogli przejrzeć i zweryfikować jego działanie. Ukłony dla autora. Korzystanie jest bezpłatne, jednak ponowna publikacja kodu podlega naszym Zasadom serwisu.
Wyłączenie odpowiedzialności
Informacje i publikacje nie stanowią i nie powinny być traktowane jako porady finansowe, inwestycyjne, tradingowe ani jakiekolwiek inne rekomendacje dostarczane lub zatwierdzone przez TradingView. Więcej informacji znajduje się w Warunkach użytkowania.