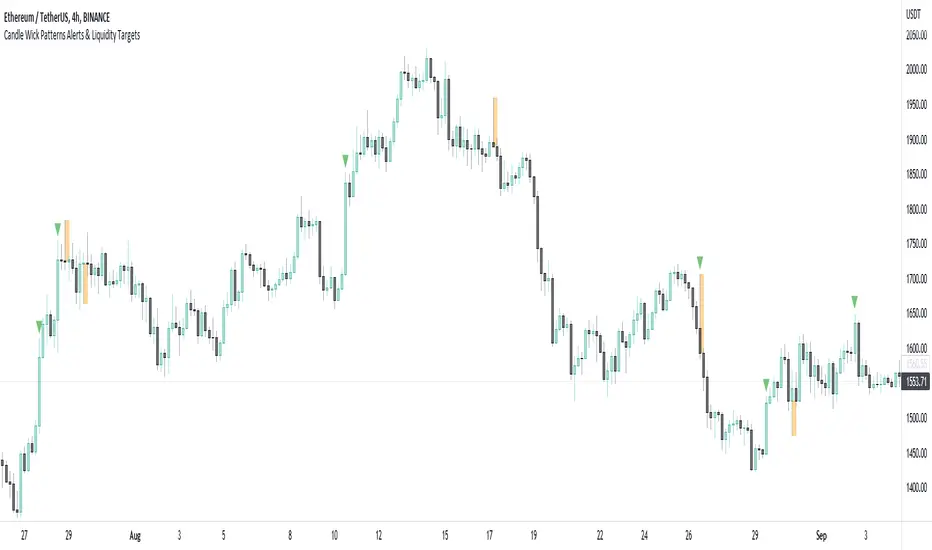
Candle Wick Patterns Alerts & Liquidity Targets

Quite simply a wick is formed by price being moved to an extreme by one side, then price being pushed back by the other side.
This can show increased pressure by one side, reduced or increased momentum, or exhaustion by another side.
This indicator while simple, is extremely powerful and versatile and can be set up to recognize numerous types of candle wick and therefore suit numerous trading styles.
The settings as to how wicks are highlighted are:
- Timeframe - view wicks on a higher timeframe while trading on a lower timeframe
- Minimum Wick to Body Ratio - increasing this value will look for wicks who are at least n times larger than the candle body. The most obvious examples here are Doji's - hammer, gravestone, dragonfly, etc. These can indicate trend reversals, indecision and changing momentum.
- Minimum Candle Body as percent of price - this value makes sure that any wick highlighted, belongs to a candle with a body that is at least n% of the price. A higher value is likely to show price momentum is stronger in a particular direction, good for confirming a trend.
- Minimum Candle Wick as percent of price - similar to candle bodies, this value will make sure the candle wick is at least n% of the price. This will identify large fluctuations in price, and if you are familiar with smart money concepts, an increasingly popular strategy is to target 50% of the wick being filled (liquidity).
- Show half fill level of wick - As above, this can provide a good target, which price will be drawn to, depending on the wick.
Finally, the indicator can be used to create alerts when a new wick that meets your settings criteria, is formed.
And don't forget you can add the indicator multiple times, with different settings to cover multiple scenarios and timeframes!
I've added a moving average to the indicator settings. You can choose the type of moving average, period and source (price and volume).
There is now an additional optional test to check if the current price/volume is greater than or less than the moving average by a certain multiplier.
Combining this with the candle wick and body configurations will allow you greater control in identifying reversals, sweeps, momentum changes and much more!
Skrypt tylko na zaproszenie
Dostęp do tego skryptu mają wyłącznie użytkownicy zatwierdzeni przez autora. Aby z niego korzystać, należy poprosić o zgodę i ją uzyskać. Zgoda jest zazwyczaj udzielana po dokonaniu płatności. Więcej informacji można znaleźć w instrukcjach autora poniżej lub kontaktując się bezpośrednio z Texmoonbeam.
TradingView NIE zaleca płacenia za skrypt ani korzystania z niego, jeśli nie ma pełnego zaufania do jego autora i nie rozumie się zasad jego działania. Można również znaleźć darmowe, otwartoźródłowe alternatywy w skryptach społeczności.
Instrukcje autora
Wyłączenie odpowiedzialności
Skrypt tylko na zaproszenie
Dostęp do tego skryptu mają wyłącznie użytkownicy zatwierdzeni przez autora. Aby z niego korzystać, należy poprosić o zgodę i ją uzyskać. Zgoda jest zazwyczaj udzielana po dokonaniu płatności. Więcej informacji można znaleźć w instrukcjach autora poniżej lub kontaktując się bezpośrednio z Texmoonbeam.
TradingView NIE zaleca płacenia za skrypt ani korzystania z niego, jeśli nie ma pełnego zaufania do jego autora i nie rozumie się zasad jego działania. Można również znaleźć darmowe, otwartoźródłowe alternatywy w skryptach społeczności.