OPEN-SOURCE SCRIPT
Put Call Oscillator

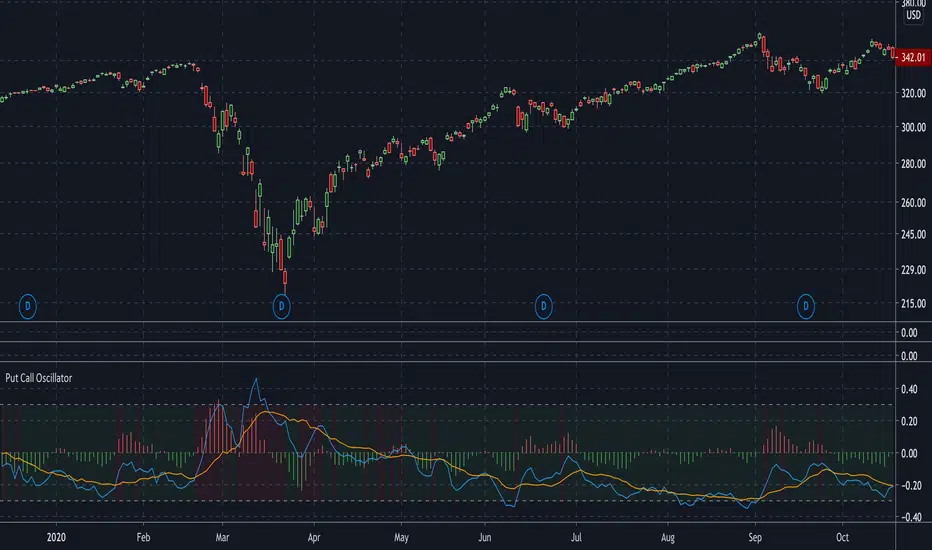
This is a volume-based oscillator used for detecting market sentiment.
This plots two moving averages of the CBOE S&P500 PCR (put call ratio), and a histogram to measure the distance between them. The histogram will generate signals of green (bullish) or red (bearish), depending on whether put volume is decreasing or increasing.
The moving averages are adjustable. They are set at 4 and 16 by default. Increasing the moving averages will generate less signals, while decreasing them will generate more signals.
The background will change color from red to green depending on whether the PCR is above or below 1.
I used capriole_charles script "Put/Call Ratio (PCR)" to help me build this.
Skrypt open-source
W zgodzie z duchem TradingView twórca tego skryptu udostępnił go jako open-source, aby użytkownicy mogli przejrzeć i zweryfikować jego działanie. Ukłony dla autora. Korzystanie jest bezpłatne, jednak ponowna publikacja kodu podlega naszym Zasadom serwisu.
Wyłączenie odpowiedzialności
Informacje i publikacje nie stanowią i nie powinny być traktowane jako porady finansowe, inwestycyjne, tradingowe ani jakiekolwiek inne rekomendacje dostarczane lub zatwierdzone przez TradingView. Więcej informacji znajduje się w Warunkach użytkowania.