OPEN-SOURCE SCRIPT
Zaktualizowano Show Daily Candles on Intraday Chart
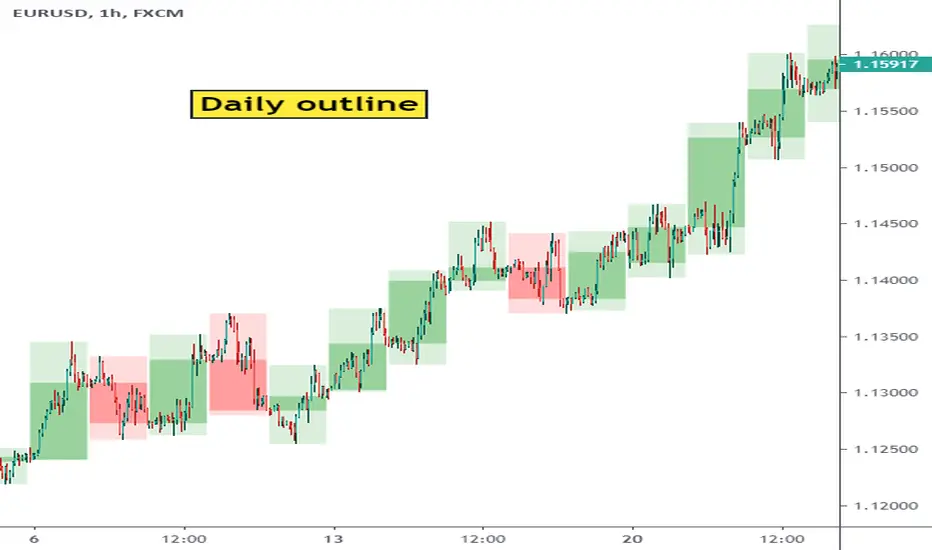
This script shows daily candle outlines on intraday periods. You can use this to simultaneously see what is happening on 'the bigger picture' without changing timeframe.
To address Tradingview moderation comments - this script only shows the outlines of completed days. So the most recent candle outline the indicator will show is yesterday.
I've not used the indicator in live trading yet so I don't know whether its going to be of useful to me yet but it was easy to code so I thought I'd give it a go. (Perhaps it will useful to people on the free tradingview subscription who have limited multi-chart options)
Informacje o Wersji
Does not function properly below 10 min periods so i deactivated it if you're on that timeframe. Pinescript does not seem to be able to look back more than 1000 bars so the script can not find where the day starts on the low timeframes...
Informacje o Wersji
other update had wrong image...Informacje o Wersji
You can now show Weekly and Monthly candles. Use the indicator options tabSkrypt open-source
W zgodzie z duchem TradingView twórca tego skryptu udostępnił go jako open-source, aby użytkownicy mogli przejrzeć i zweryfikować jego działanie. Ukłony dla autora. Korzystanie jest bezpłatne, jednak ponowna publikacja kodu podlega naszym Zasadom serwisu.
Wyłączenie odpowiedzialności
Informacje i publikacje nie stanowią i nie powinny być traktowane jako porady finansowe, inwestycyjne, tradingowe ani jakiekolwiek inne rekomendacje dostarczane lub zatwierdzone przez TradingView. Więcej informacji znajduje się w Warunkach użytkowania.
Skrypt open-source
W zgodzie z duchem TradingView twórca tego skryptu udostępnił go jako open-source, aby użytkownicy mogli przejrzeć i zweryfikować jego działanie. Ukłony dla autora. Korzystanie jest bezpłatne, jednak ponowna publikacja kodu podlega naszym Zasadom serwisu.
Wyłączenie odpowiedzialności
Informacje i publikacje nie stanowią i nie powinny być traktowane jako porady finansowe, inwestycyjne, tradingowe ani jakiekolwiek inne rekomendacje dostarczane lub zatwierdzone przez TradingView. Więcej informacji znajduje się w Warunkach użytkowania.