OPEN-SOURCE SCRIPT
Auto Fibo on Indicators
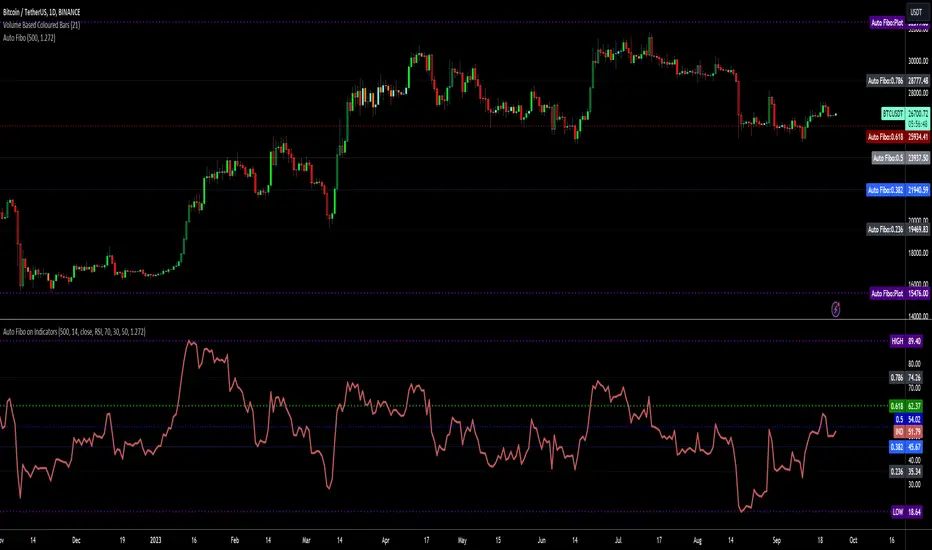
This drawing tool aims to draw auto Fibonacci Retracement Levels on desired indicators.
Users can define the target indicator to draw Auto Fibo Lines, from the "settings tab":
There are six commonly used indicators below the charts that can be selected to draw Fibonacci Retracement lines on:
RSI : Relative Strength Index
CCI : Commodity Channel Index
MFI : Money Flow Index
STOCHASTIC : Stochastic Oscillator
CMF : Chaikin Money Flow
CMO : Chande Momentum Oscillator
Fibonacci Retracement Levels will appear automatically after applying the indicator.
The "Auto Fibo on Indicators" tool looks back. It checks the indicator levels for a desired number of bars and then draws the Fibonacci Levels automatically in the right way, considering the final movements of the indicator.
There are five commonly used Fibonacci Levels added between the Highest and Lowest values such as:
%23.6
%38.2
%50 (Not precisely a Fibonacci Level, indeed)
%61.8 (Golden Ratio)
%78.6
Four extra levels can be added from the settings tab by checking their boxes:
%127.2 (adjustable level)
%161.8
%261.8
%361.8
Default lookback bars of Auto Fibo Levels: 144 (which is also a Fibonacci number)
Default Indicator: RSI
Default Indicator length: 14
Default data source: CLOSE
Users can also define and show overbought and oversold levels by unchecking the "Do not Show Indicator Overbought / Oversold Levels?" button from the settings menu.
In technical analysis, Fibonacci Levels on price can guide valuable trading signals for investors.
Levels can be significant support and resistance levels for breakouts and turning points.
This drawing tool aims to follow those necessary levels on indicators to observe critical levels and breakouts.
Skrypt open-source
W prawdziwym duchu TradingView autor tego skryptu opublikował go jako open source, aby inwestorzy mogli go zrozumieć i zweryfikować. Pozdrowienia dla autora! Możesz go używać bezpłatnie, ale ponowne użycie tego kodu w publikacji podlega Zasadom Regulaminu. Możesz go oznaczyć jako ulubione, aby użyć go na wykresie.
Telegram t.me/AlgoRhytm
YouTube (Turkish): youtube.com/c/kivancozbilgic
YouTube (English): youtube.com/c/AlgoWorld
YouTube (Turkish): youtube.com/c/kivancozbilgic
YouTube (English): youtube.com/c/AlgoWorld
Wyłączenie odpowiedzialności
Informacje i publikacje przygotowane przez TradingView lub jego użytkowników, prezentowane na tej stronie, nie stanowią rekomendacji ani porad handlowych, inwestycyjnych i finansowych i nie powinny być w ten sposób traktowane ani wykorzystywane. Więcej informacji na ten temat znajdziesz w naszym Regulaminie.