OPEN-SOURCE SCRIPT
Correlation Coefficient Table
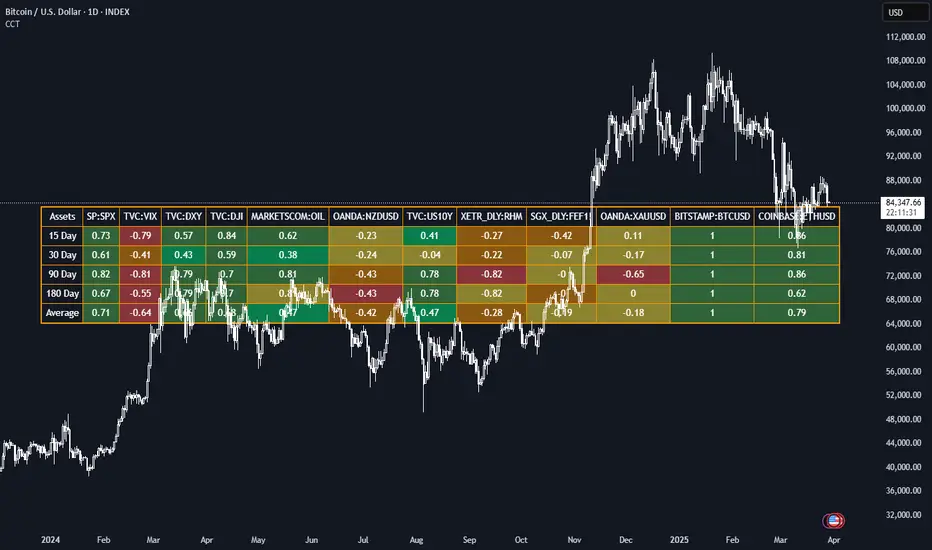
This Pine Script generates a dynamic table for analyzing how multiple assets correlate with a chosen benchmark (e.g., NZ50G). Users can input up to 12 asset symbols, customize the benchmark, and define the beta calculation periods (e.g., 15, 30, 90, 180 days). The script calculates Correlation values for each asset over these periods and computes the average beta for better insights.
The table includes:
Asset symbols: Displayed in the first row.
Correlation values: Calculated for each defined period and displayed in subsequent columns.
Average Correlation: Presented in the final column as an overall measure of correlation strength.
Color coding: Background colors indicate beta magnitude (green for high positive beta, yellow for near-neutral beta, red for negative beta).
Skrypt open-source
W zgodzie z duchem TradingView twórca tego skryptu udostępnił go jako open-source, aby użytkownicy mogli przejrzeć i zweryfikować jego działanie. Ukłony dla autora. Korzystanie jest bezpłatne, jednak ponowna publikacja kodu podlega naszym Zasadom serwisu.
Wyłączenie odpowiedzialności
Informacje i publikacje nie stanowią i nie powinny być traktowane jako porady finansowe, inwestycyjne, tradingowe ani jakiekolwiek inne rekomendacje dostarczane lub zatwierdzone przez TradingView. Więcej informacji znajduje się w Warunkach użytkowania.