PROTECTED SOURCE SCRIPT
Super curved trend session forecast [CLEVER]
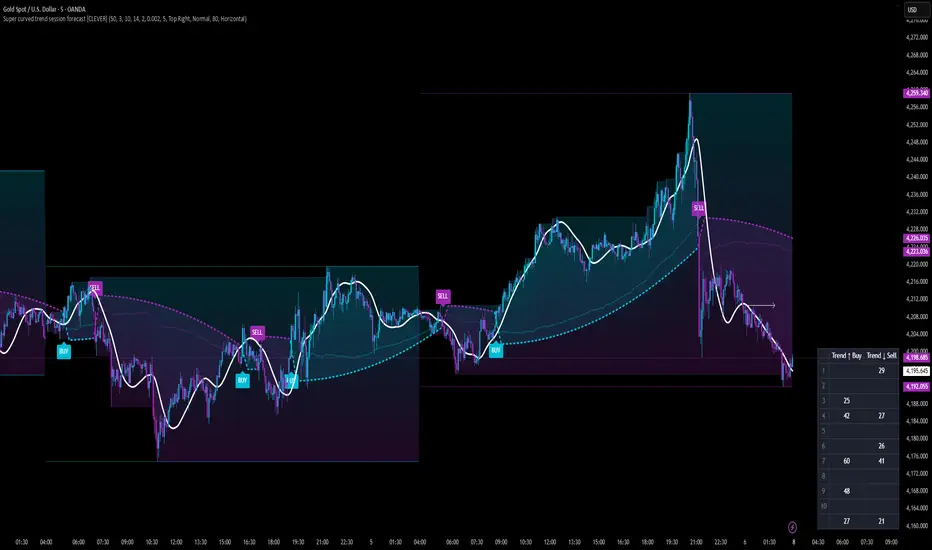
📊✨ Super curved trend [CLEVER] 🔮
The Future of Trend Prediction, Visualized.
🔥Super curved trend session forecast [CLEVER] is not just another trend indicator — it’s a high-precision forecasting system engineered to decode how long trends truly last, how strong they are, and when they are most likely to fade away.
Built using a fusion of Hull Moving Average (HMA), Curved Radius Supertrend, CLEVER Streak Analytics, this advanced Pine Script tool goes far beyond simple color changes — it analyzes, measures, and predicts market rhythm in real-time.
🧠 Core Concept:
Every market has a pulse — trends form, rise, and eventually die out.
The Trend Duration Forecast identifies the beginning of a new bullish 🟢 or bearish 🔴 phase, tracks its strength and slope, and then intelligently forecasts the probable continuation length ⏳ of that trend based on the historical average of previous movements.
When a new phase begins, the indicator automatically projects forward — showing how far the current trend can statistically go before exhaustion.
It also visually marks potential BUY 🟩 or SELL 🟥 zones with projected boundaries, helping traders anticipate not just what direction the market is going — but for how long.

 BTCUSD
  USOIL
USOIL  XAUUSD
 EURCHF
⚙️ Technical Architecture:
🧩 1. Hull Moving Average (HMA):
The heart of the system. It reacts faster than a standard MA but remains smooth enough to filter out false spikes. HMA’s slope determines the active trend phase and strength gradient.
🌀 2. Supertrend:
A next-gen enhancement to the classic Supertrend. Instead of linear lines, it uses curved ATR-based support and resistance paths that bend with price acceleration — giving you a dynamic visual flow of market structure and reducing whipsaws in volatile sessions.
📈 3. CLEVER Session
XAUUSD
USDCNH
GBPMXN
USDCHF
USOIL
EURUSD
DXY
BTCUSD
snapshot
Analytics:
Borrowed from high-end statistical modules, this tracks how many sessions have been consecutively bullish or bearish — revealing hidden rhythm patterns and market exhaustion points.
It also provides median, mode, and count streak data in a clean, optional dashboard overlay.
🎨 Visuals & Display:
✨ Color-coded candles change with trend state for instant clarity.
📊 Adaptive projection lines show trend duration zones and forecast targets.
🧾 A detailed Trend Duration Table lists the average length of past bullish/bearish runs, enabling data-backed decisions.
🔍 Smooth dynamic curvature ensures the chart looks clean yet highly responsive — ideal for both analysis and presentation.
💡 Practical Benefits:
✅ Forecast Continuation: Know how long your current trend is statistically likely to last before it weakens.
✅ Early Reversal Alerts: Identify when a new bullish or bearish phase is starting before the crowd.
✅ Smart Timing: Align your entries/exits with historical rhythm rather than random volatility.
✅ Visual Precision: Instantly recognize strength, direction, and duration from adaptive curves and color-coded visuals.
✅ Data-Driven Confidence: Trade with statistical context, not just visual cues.
🧭 Ideal For:
💥 Swing Traders – time your trades at the start of trend cycles.
⚡ Scalpers & Intraday Traders – catch short-term momentum while avoiding fake-outs.
🤖 Algorithmic Traders – integrate statistical forecasting into automated strategies.
📉 Market Analysts – visually present complex data in a digestible, story-driven way.
🧠 In Essences combines trend detection, duration prediction, and volatility curvature modeling into one seamless system.
It’s designed to make you see trends not just as lines — but as living patterns with measurable lifespans.
With this tool, you no longer trade reactively —
You trade intelligently, early, and with foresight. 🔥
🏁 Summary:
🔹 Advanced HMA-based trend detection
🔹 Dynamic Curved Radius Supertrend support/resistance
🔹 Statistical trend duration forecasting
🔹 CLEVER streak analytics module
🔹 BUY/SELL projection zones
🔹 Adaptive color-coded candles
🔹 On-chart dashboard + historical duration table
🚀 The future of precision trend analysis is Super curved trend session forecast [CLEVER] —
See the trend. Measure its life. Predict its end. 🌙📈
The Future of Trend Prediction, Visualized.
🔥Super curved trend session forecast [CLEVER] is not just another trend indicator — it’s a high-precision forecasting system engineered to decode how long trends truly last, how strong they are, and when they are most likely to fade away.
Built using a fusion of Hull Moving Average (HMA), Curved Radius Supertrend, CLEVER Streak Analytics, this advanced Pine Script tool goes far beyond simple color changes — it analyzes, measures, and predicts market rhythm in real-time.
🧠 Core Concept:
Every market has a pulse — trends form, rise, and eventually die out.
The Trend Duration Forecast identifies the beginning of a new bullish 🟢 or bearish 🔴 phase, tracks its strength and slope, and then intelligently forecasts the probable continuation length ⏳ of that trend based on the historical average of previous movements.
When a new phase begins, the indicator automatically projects forward — showing how far the current trend can statistically go before exhaustion.
It also visually marks potential BUY 🟩 or SELL 🟥 zones with projected boundaries, helping traders anticipate not just what direction the market is going — but for how long.
⚙️ Technical Architecture:
🧩 1. Hull Moving Average (HMA):
The heart of the system. It reacts faster than a standard MA but remains smooth enough to filter out false spikes. HMA’s slope determines the active trend phase and strength gradient.
🌀 2. Supertrend:
A next-gen enhancement to the classic Supertrend. Instead of linear lines, it uses curved ATR-based support and resistance paths that bend with price acceleration — giving you a dynamic visual flow of market structure and reducing whipsaws in volatile sessions.
📈 3. CLEVER Session
XAUUSD
USDCNH
GBPMXN
USDCHF
USOIL
EURUSD
DXY
BTCUSD
snapshot
Analytics:
Borrowed from high-end statistical modules, this tracks how many sessions have been consecutively bullish or bearish — revealing hidden rhythm patterns and market exhaustion points.
It also provides median, mode, and count streak data in a clean, optional dashboard overlay.
🎨 Visuals & Display:
✨ Color-coded candles change with trend state for instant clarity.
📊 Adaptive projection lines show trend duration zones and forecast targets.
🧾 A detailed Trend Duration Table lists the average length of past bullish/bearish runs, enabling data-backed decisions.
🔍 Smooth dynamic curvature ensures the chart looks clean yet highly responsive — ideal for both analysis and presentation.
💡 Practical Benefits:
✅ Forecast Continuation: Know how long your current trend is statistically likely to last before it weakens.
✅ Early Reversal Alerts: Identify when a new bullish or bearish phase is starting before the crowd.
✅ Smart Timing: Align your entries/exits with historical rhythm rather than random volatility.
✅ Visual Precision: Instantly recognize strength, direction, and duration from adaptive curves and color-coded visuals.
✅ Data-Driven Confidence: Trade with statistical context, not just visual cues.
🧭 Ideal For:
💥 Swing Traders – time your trades at the start of trend cycles.
⚡ Scalpers & Intraday Traders – catch short-term momentum while avoiding fake-outs.
🤖 Algorithmic Traders – integrate statistical forecasting into automated strategies.
📉 Market Analysts – visually present complex data in a digestible, story-driven way.
🧠 In Essences combines trend detection, duration prediction, and volatility curvature modeling into one seamless system.
It’s designed to make you see trends not just as lines — but as living patterns with measurable lifespans.
With this tool, you no longer trade reactively —
You trade intelligently, early, and with foresight. 🔥
🏁 Summary:
🔹 Advanced HMA-based trend detection
🔹 Dynamic Curved Radius Supertrend support/resistance
🔹 Statistical trend duration forecasting
🔹 CLEVER streak analytics module
🔹 BUY/SELL projection zones
🔹 Adaptive color-coded candles
🔹 On-chart dashboard + historical duration table
🚀 The future of precision trend analysis is Super curved trend session forecast [CLEVER] —
See the trend. Measure its life. Predict its end. 🌙📈
Skrypt chroniony
Ten skrypt został opublikowany jako zamknięty kod źródłowy. Można z tego korzystać swobodnie i bez żadnych ograniczeń — więcej informacji znajduje się tutaj.
Wyłączenie odpowiedzialności
Informacje i publikacje nie stanowią i nie powinny być traktowane jako porady finansowe, inwestycyjne, tradingowe ani jakiekolwiek inne rekomendacje dostarczane lub zatwierdzone przez TradingView. Więcej informacji znajduje się w Warunkach użytkowania.