OPEN-SOURCE SCRIPT
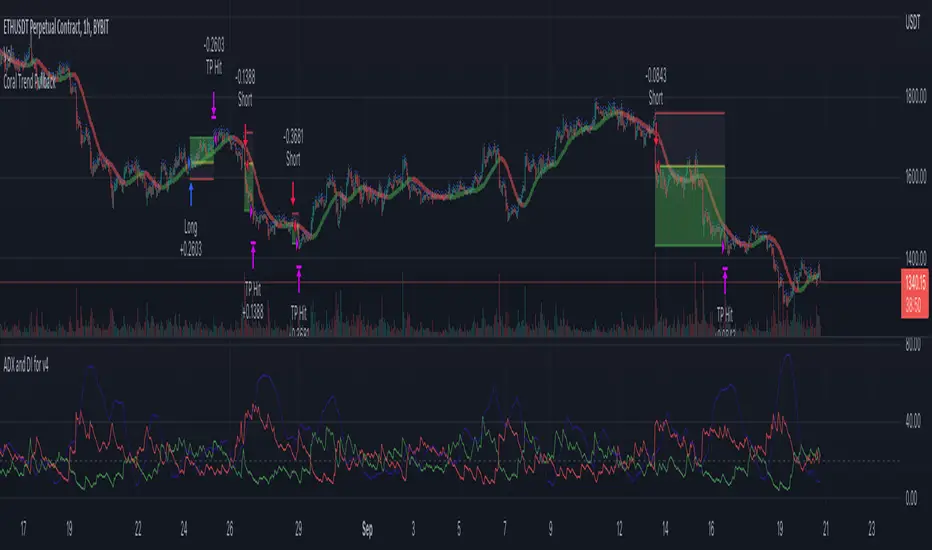
Coral Trend Pullback Strategy (TradeIQ)

Description:
Strategy is taken from the TradeIQ YouTube video called "I Finally Found 80% Win Rate Trading Strategy For Crypto".
Check out the full video for further details/clarification on strategy entry/exit conditions.
The default settings are exactly as TradeIQ described in his video.
However I found some better results by some tweaking settings, increasing R:R ratio and by turning off confirmation indicators.
This would suggest that perhaps the current confirmation indicators are not the best options. I'm happy to try add some other optional confirmation indicators if they look to be more effective.
Recommended timeframe: 1H
Strategy incorporates the following features:
Risk management:
Trade entry:
Trade exit:
Backtesting:
Trade drawings:
Alerting:
Debugging:
Strategy conditions
Trade entry:
LONG
SHORT
NOTE: All the optional confirmation indicators cannot be overlayed with Coral Trend so feel free to add each separately to the chart for visual purposes
Trade exit:
Credits
Strategy origin: TradeIQ's YouTube video called "I Finally Found 80% Win Rate Trading Strategy For Crypto"
It combines the following indicators for trade entry conditions:
Strategy is taken from the TradeIQ YouTube video called "I Finally Found 80% Win Rate Trading Strategy For Crypto".
Check out the full video for further details/clarification on strategy entry/exit conditions.
The default settings are exactly as TradeIQ described in his video.
However I found some better results by some tweaking settings, increasing R:R ratio and by turning off confirmation indicators.
This would suggest that perhaps the current confirmation indicators are not the best options. I'm happy to try add some other optional confirmation indicators if they look to be more effective.
Recommended timeframe: 1H
Strategy incorporates the following features:
Risk management:
- Configurable X% loss per stop loss
- Configurable R:R ratio
Trade entry:
- Based on strategy conditions below
Trade exit:
- Based on strategy conditions below
Backtesting:
- Configurable backtesting range by date
Trade drawings:
- Each entry condition indicator can be turned on and off
- TP/SL boxes drawn for all trades. Can be turned on and off
- Trade exit information labels. Can be turned on and off
- NOTE: Trade drawings will only be applicable when using overlay strategies
Alerting:
- Alerts on LONG and SHORT trade entries
Debugging:
- Includes section with useful debugging techniques
Strategy conditions
Trade entry:
LONG
- C1: Coral Trend is bullish
- C2: At least 1 candle where low is above Coral Trend since last cross above Coral Trend
- C3: Pullback happens and price closes below Coral Trend
- C4: Coral Trend colour remains bullish for duration of pullback
- C5: After valid pullback, price then closes above Coral Trend
- C6: Optional confirmation indicators (choose either C6.1 or C6.2 or NONE):
- C6.1: ADX and DI (Single indicator)
- C6.1.1: Green line is above red line
- C6.1.2: Blue line > 20
- C6.1.3: Blue trending up over last 1 candle
- C6.2: Absolute Strengeh Histogram + HawkEye Volume Indicator (Two indicators combined)
- C6.2.1: Absolute Strengeh Histogram colour is blue
- C6.2.2: HawkEye Volume Indicator colour is green
SHORT
- C1: Coral Trend is bearish
- C2: At least 1 candle where high is below Coral Trend since last cross below Coral Trend
- C3: Pullback happens and price closes above Coral Trend
- C4: Coral Trend colour remains bearish for duration of pullback
- C5: After valid pullback, price then closes below Coral Trend
- C6: Optional confirmation indicators (choose either C6.1 or C6.2 or NONE):
- C6.1: ADX and DI (Single indicator)
- C6.1.1: Red line is above green line
- C6.1.2: Blue line > 20
- C6.1.3: Blue trending up over last 1 candle
- C6.2: Absolute Strengeh Histogram + HawkEye Volume Indicator (Two indicators combined)
- C6.2.1: Absolute Strengeh Histogram colour is red
- C6.2.2: HawkEye Volume Indicator colour is red
NOTE: All the optional confirmation indicators cannot be overlayed with Coral Trend so feel free to add each separately to the chart for visual purposes
Trade exit:
- Stop Loss: Calculated by recent swing low over previous X candles (configurable with "Local High/Low Lookback")
- Take Profit: Calculated from R:R multiplier * Stop Loss size
Credits
Strategy origin: TradeIQ's YouTube video called "I Finally Found 80% Win Rate Trading Strategy For Crypto"
It combines the following indicators for trade entry conditions:
- Coral Trend Indicator [LazyBear] by LazyBear (Main indicator)
- Absolute Strength Histogram | jh by jiehonglim (Optional confirmation indicator)
- Indicator: HawkEye Volume Indicator by LazyBear (Optional confirmation indicator)
- ADX and DI by BeikabuOyaji (Optional confirmation indicator)
Skrypt open-source
W zgodzie z duchem TradingView twórca tego skryptu udostępnił go jako open-source, aby użytkownicy mogli przejrzeć i zweryfikować jego działanie. Ukłony dla autora. Korzystanie jest bezpłatne, jednak ponowna publikacja kodu podlega naszym Zasadom serwisu.
Wyłączenie odpowiedzialności
Informacje i publikacje nie stanowią i nie powinny być traktowane jako porady finansowe, inwestycyjne, tradingowe ani jakiekolwiek inne rekomendacje dostarczane lub zatwierdzone przez TradingView. Więcej informacji znajduje się w Warunkach użytkowania.