OPEN-SOURCE SCRIPT
Zaktualizowano SMA Direction Cross Currency Summary
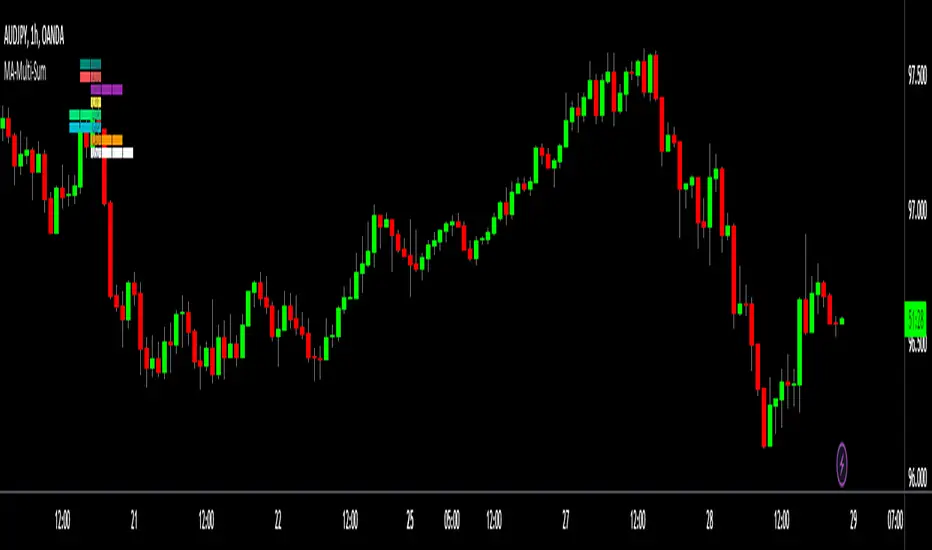
This script shows the average SMA direction of each of the majors and crosses when compared to each other. The more blocks to the right the stronger the currency on that timeframe. The more blocks to the left the weaker the currency.
I'm finding it useful to quickly know the average flow of movement for each currency on the higher timeframes and then focus on that for a daily trade. I also like how i dont have to keep jumping between instruments to stay upto date. I'm not a 'real' trader so I have very limited time and attention for this so this does the job as a crude replacement for trawling all the chart each day.

The currencies compared are:
-NZD
-AUD
-JPY
-CHF
-EUR
-GBP
-CAD
-USD
The way it is calculated is that its based on the 20 SMA. For each currency vs the other crosses:
if the SMA is pointing up and price is higher = +2
if the SMA is pointing up and price is lower = +1
if the SMA is pointing down and price is higher = -2
if the SMA is pointing down and price is lower = -1
So if we where considering GBP. We would do that for GBPNZD, GBPAUD, GBPPJY, GBPCHF, GBPEUR, GBPCAD, GBPUSD. We would then consider this sum against all the currencies to understand the relative strength.
Due to the limit on how many instruments can be called in a single indicated you need to load it for each currencies so 8 currencies = 8 indicators.
Its a bit of a frankinstien script - it just throw it togeather so its probably got redundant code etc. Its built around 20 SMA - no idea what would happens when you change that.
I'm finding it useful to quickly know the average flow of movement for each currency on the higher timeframes and then focus on that for a daily trade. I also like how i dont have to keep jumping between instruments to stay upto date. I'm not a 'real' trader so I have very limited time and attention for this so this does the job as a crude replacement for trawling all the chart each day.
The currencies compared are:
-NZD
-AUD
-JPY
-CHF
-EUR
-GBP
-CAD
-USD
The way it is calculated is that its based on the 20 SMA. For each currency vs the other crosses:
if the SMA is pointing up and price is higher = +2
if the SMA is pointing up and price is lower = +1
if the SMA is pointing down and price is higher = -2
if the SMA is pointing down and price is lower = -1
So if we where considering GBP. We would do that for GBPNZD, GBPAUD, GBPPJY, GBPCHF, GBPEUR, GBPCAD, GBPUSD. We would then consider this sum against all the currencies to understand the relative strength.
Due to the limit on how many instruments can be called in a single indicated you need to load it for each currencies so 8 currencies = 8 indicators.
Its a bit of a frankinstien script - it just throw it togeather so its probably got redundant code etc. Its built around 20 SMA - no idea what would happens when you change that.
Informacje o Wersji
Now you can cover 4 currencies with 1 indicator. (2 instances will cover all 8 majors and crosses)Informacje o Wersji
Now loads all currencies in 1 indicatorInformacje o Wersji
fixing problemSkrypt open-source
W zgodzie z duchem TradingView twórca tego skryptu udostępnił go jako open-source, aby użytkownicy mogli przejrzeć i zweryfikować jego działanie. Ukłony dla autora. Korzystanie jest bezpłatne, jednak ponowna publikacja kodu podlega naszym Zasadom serwisu.
Wyłączenie odpowiedzialności
Informacje i publikacje nie stanowią i nie powinny być traktowane jako porady finansowe, inwestycyjne, tradingowe ani jakiekolwiek inne rekomendacje dostarczane lub zatwierdzone przez TradingView. Więcej informacji znajduje się w Warunkach użytkowania.
Skrypt open-source
W zgodzie z duchem TradingView twórca tego skryptu udostępnił go jako open-source, aby użytkownicy mogli przejrzeć i zweryfikować jego działanie. Ukłony dla autora. Korzystanie jest bezpłatne, jednak ponowna publikacja kodu podlega naszym Zasadom serwisu.
Wyłączenie odpowiedzialności
Informacje i publikacje nie stanowią i nie powinny być traktowane jako porady finansowe, inwestycyjne, tradingowe ani jakiekolwiek inne rekomendacje dostarczane lub zatwierdzone przez TradingView. Więcej informacji znajduje się w Warunkach użytkowania.