PROTECTED SOURCE SCRIPT
Zaktualizowano CCI heatmap(15-170)
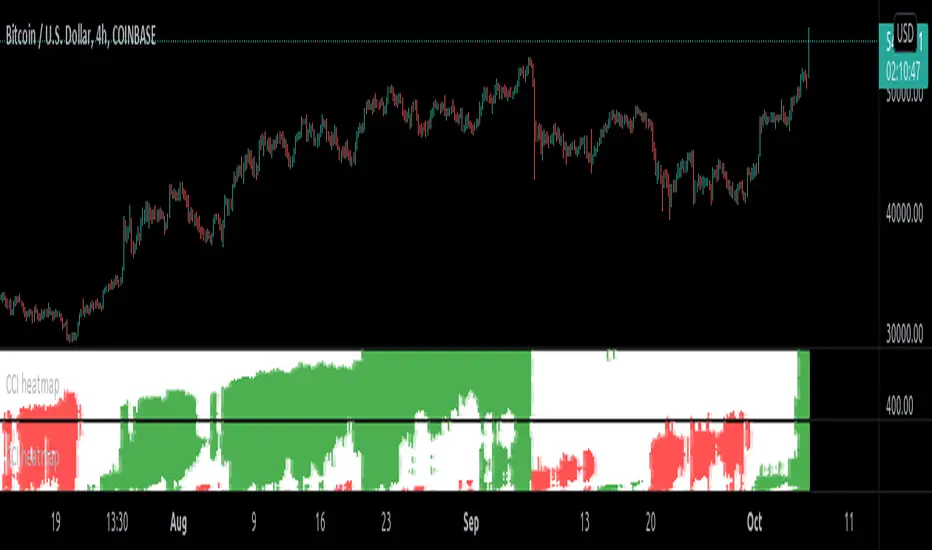
This is CCI (Commodity channel index) heatmap for the period lengths (15 to 170).
How to use :
1.) When overwhelming green appears, it means price is supposed to be trending up.
2.) When white appears, it means price is supposed to be neutral.
3.) When overwhelming red appears, it means price is supposed to be trending down.
Note: This indicator is supposed to be used with CCI heatmap(175-330) and CCI heatmap(335-490) aligned in increasing order of period lengths for higher resolution of period lengths. Otherwise use CCI heatmap(low resolution) indicator in which these 3 high resolution indicator is adjusted to a single indicator.
(Expect remaining indicator to be published to the public in mid of march 2021)
Informacje o Wersji
Expanded the current script from input lengths (15-170) to now (20-330). Therefore no need of multiple instances/resolutions of same indicator.Informacje o Wersji
This is advanced version of CCI ( Commodity channel index ) heatmap .
Add 2 instances of same indicator and put 'set2 lengths' above 'set1 lengths' (align in increasing order of period lengths) to get continuous pattern for larger picture otherwise you can always use just default set1 as well .
How to use :
1.) When overwhelming green appears, it means price is supposed to be trending up.
2.) When overwhelming red appears, it means price is supposed to be trending down.
3.) When white appears, it means price is currently neutral , at this point get ready and expect a breakout in either direction . In other words overwhelming white suggest asset is currently highly compressed(fuel in the tank) and expected to expand(burn the fuel) in either direction .
Did you know : CCI resembles Bollinger bands with 1.25 standard deviation . In CCI +100 and -100 resembles upper and lower band of bollinger band with 1.25 standard deviation (multi).
Skrypt chroniony
Ten skrypt został opublikowany jako zamknięty kod źródłowy. Można z tego korzystać swobodnie i bez żadnych ograniczeń — więcej informacji znajduje się tutaj.
Wyłączenie odpowiedzialności
Informacje i publikacje nie stanowią i nie powinny być traktowane jako porady finansowe, inwestycyjne, tradingowe ani jakiekolwiek inne rekomendacje dostarczane lub zatwierdzone przez TradingView. Więcej informacji znajduje się w Warunkach użytkowania.