OPEN-SOURCE SCRIPT
30-Week SMA (Fixed)

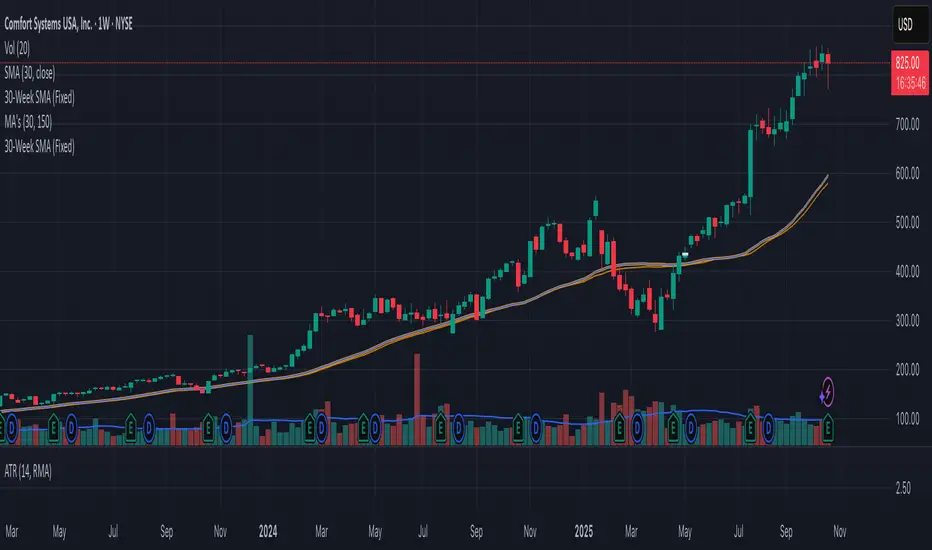
This indicator plots a true 30-week Simple Moving Average (SMA) on any chart, regardless of the selected timeframe.
It uses weekly candle data (via the request.security() function) to calculate the 30-week average and keeps it fixed — meaning the line remains accurate even when you switch to daily, 4-hour, or other timeframes.
The 30-week SMA is a cornerstone of Stan Weinstein’s Stage Analysis strategy, commonly used to identify major trend phases:
Above a rising SMA → bullish (Stage 2 uptrend)
Below a falling SMA → bearish (Stage 4 downtrend)
Use this indicator to maintain a consistent long-term trend filter on all timeframes
Skrypt open-source
W zgodzie z duchem TradingView twórca tego skryptu udostępnił go jako open-source, aby użytkownicy mogli przejrzeć i zweryfikować jego działanie. Ukłony dla autora. Korzystanie jest bezpłatne, jednak ponowna publikacja kodu podlega naszym Zasadom serwisu.
Wyłączenie odpowiedzialności
Informacje i publikacje nie stanowią i nie powinny być traktowane jako porady finansowe, inwestycyjne, tradingowe ani jakiekolwiek inne rekomendacje dostarczane lub zatwierdzone przez TradingView. Więcej informacji znajduje się w Warunkach użytkowania.