INVITE-ONLY SCRIPT
BOSS Bullish/Bearish Quantitative Qualitative Estimation (QQE)
Zaktualizowano

THE BEST FOREX, BINARY OPTIONS, AND CRYPTO INDICATORS FOR TRADINGVIEW.COM
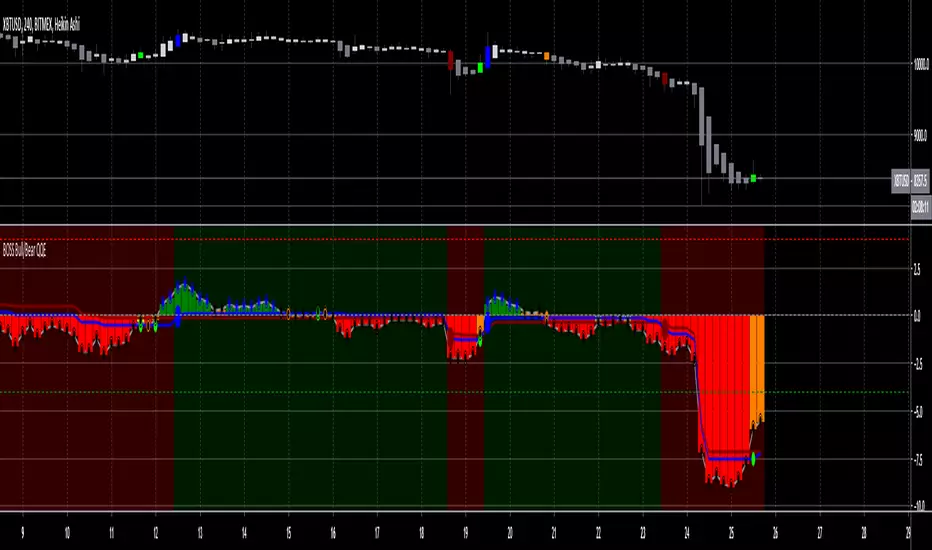
This indicator is comprised by a smoothed Relative Strength Index and two trailing levels, based on volatility – Fast Trailing Level (Fast TL – the maroon line on the chart above) and Slow Trailing Level (Slow TL – the blue line on the chart above).
The two are determined by calculating the Average True Range (ATR) of the smoothed RSI during a specified number of periods, after which a further ATR smoothing is applied with the use of an additional n-periods Wilders smoothing function.
Ultimately, the RSI’s smoothed ATR is multiplied by the Fast and Slow ATR Multipliers in order to determine the final Fast and Slow Trailing Levels.
Trading the QQE buy and sell signals:
Buy Signal
Bullish crossover happens when Fast ATR TL crosses above Slow ATR TL. When this occurs a blue circle & blue candle will appear and a alert signal to buy is generated.
Sell Signal
Bearish crossover happens when Slow ATR TL crosses above Fast ATR TL. When this occurs a maroon circle & maroon candle will appear and a alert signal to sell is generated.
Bullish/Bearish Divergence Background
Green background indicates Bullish Divergence
Red background indicates Bearish Divergence
Overbought and Oversold Conditions
An overbought condition occurs, when the QQE is at or above its 0.10 level.
An oversold condition occurs, when the QQE is at or below its -.10 level.
Informacje o Wersji
RSI Buy Signal Bullish crossover happens when RSI crosses above Fast ATR TL . When this occurs a lime circle will appear and a alert signal to buy is generated.
RSI Sell Signal
Bearish crossover happens when RSI crosses below Fast ATR TL. When this occurs a orange circle will appear and a alert signal to sell is generated.
**RSI is Gray Line On Chart
Informacje o Wersji
Changed Fast ATR Trailing Line Multiplier from 1.618 to 2.618Informacje o Wersji
updated bar colorInformacje o Wersji
added candle color to correlate with bullish and bearish RSI crossoversInformacje o Wersji
added RSI cross candle color correlation Informacje o Wersji
black fish-eye = stay in short positionblue fish-eye = stay in long position
set alerts to once per bar
at mid-line crossover you will receive two alerts this indicates time to close long or short position and open a long or short position.
Skrypt tylko na zaproszenie
Dostęp do tego skryptu mają tylko użytkownicy upoważnieni przez autora i zazwyczaj wiąże się z opłatą. Możesz dodać go do ulubionych, ale będziesz mógł z niego korzystać dopiero po uzyskaniu zgody jego autora. Skontaktuj się z TradingSafely po więcej informacji lub postępuj zgodnie z instrukcjami autora poniżej.
TradingView nie sugeruje płacenia za skrypt i korzystania z niego, jeśli nie ufasz w 100% jego autorowi i nie rozumiesz, jak działa skrypt. W wielu przypadkach możesz znaleźć dobrą alternatywę open-source za darmo w naszych Skryptach Społeczności.
Instrukcje autora
″
Chcesz użyć tego skryptu na wykresie?
Ostrzeżenie: przeczytaj to zanim poprosisz o dostęp.
🚀 LinkTree: linktr.ee/TradingSafely
📊 SECTOR SPDR ETFs: tradingsafely.net/spdr
🚨 Trade Ideas: tradingsafely.net/trade-ideas/
📈 StockTwits: stocktwits.com/r/TradingSafely
📚 TV Course: bit.ly/32sLUBo
📊 SECTOR SPDR ETFs: tradingsafely.net/spdr
🚨 Trade Ideas: tradingsafely.net/trade-ideas/
📈 StockTwits: stocktwits.com/r/TradingSafely
📚 TV Course: bit.ly/32sLUBo
Wyłączenie odpowiedzialności
Informacje i publikacje przygotowane przez TradingView lub jego użytkowników, prezentowane na tej stronie, nie stanowią rekomendacji ani porad handlowych, inwestycyjnych i finansowych i nie powinny być w ten sposób traktowane ani wykorzystywane. Więcej informacji na ten temat znajdziesz w naszym Regulaminie.