OPEN-SOURCE SCRIPT
Zaktualizowano Trend Volume Accumulations [LuxAlgo]
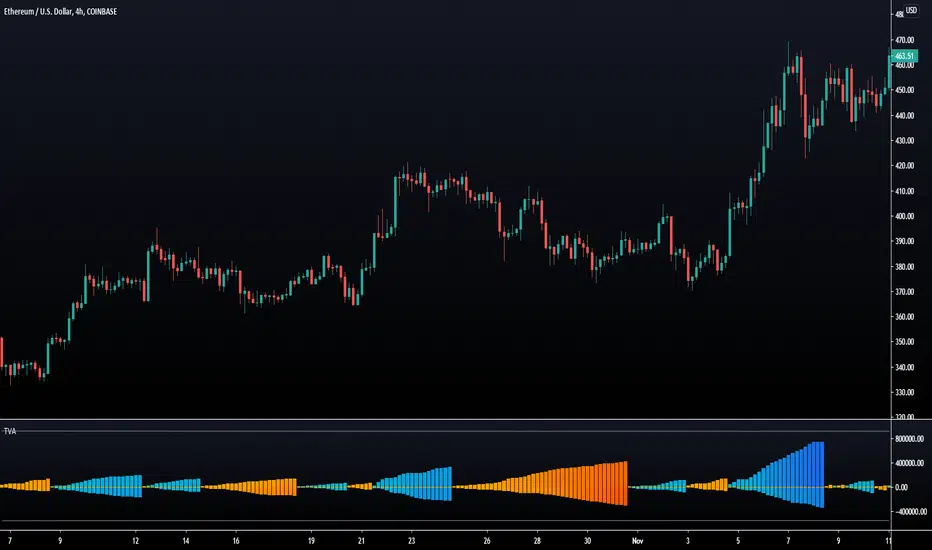
Deeply inspired by the Weiss wave indicator, the following indicator aims to return the accumulations of rising and declining volume of a specific trend. Positive waves are constructed using rising volume while negative waves are using declining volume.
The trend is determined by the sign of the rise of a rolling linear regression.
Settings
Usages
The trend volume accumulations (TVA) indicator allows determining the current price trend while taking into account volume, with blue colors representing an uptrend and red colors representing a downtrend.
The first motivation behind this indicator was to see if movements mostly made of declining volume were different from ones made of rising volume.

Waves of low amplitude represent movements with low trading activity.

Using higher values of Linearity allows giving less importance to individual volumes values, thus returning more linear waves as a result.

The indicator includes two levels, the upper one is derived from the cumulative mean of the waves based on rising volume, while the lower one is based on the cumulative mean of the waves based on declining volume, when a wave reaches a level we can expect the current trend to reverse. You can use different values of mult to control the distance from 0 of each level.
The trend is determined by the sign of the rise of a rolling linear regression.
Settings
- Length : Period of the indicator.
- Src : Source of the indicator.
- Linearity : Allows the output of the indicator to look more linear.
- Mult : the multiplicative factor of both the upper and lower levels
- Gradient : Use a gradient as color for the waves, true by default.
Usages
The trend volume accumulations (TVA) indicator allows determining the current price trend while taking into account volume, with blue colors representing an uptrend and red colors representing a downtrend.
The first motivation behind this indicator was to see if movements mostly made of declining volume were different from ones made of rising volume.
Waves of low amplitude represent movements with low trading activity.
Using higher values of Linearity allows giving less importance to individual volumes values, thus returning more linear waves as a result.
The indicator includes two levels, the upper one is derived from the cumulative mean of the waves based on rising volume, while the lower one is based on the cumulative mean of the waves based on declining volume, when a wave reaches a level we can expect the current trend to reverse. You can use different values of mult to control the distance from 0 of each level.
Informacje o Wersji
Minor Changes.Informacje o Wersji
Update to script title.Skrypt open-source
W zgodzie z duchem TradingView twórca tego skryptu udostępnił go jako open-source, aby użytkownicy mogli przejrzeć i zweryfikować jego działanie. Ukłony dla autora. Korzystanie jest bezpłatne, jednak ponowna publikacja kodu podlega naszym Zasadom serwisu.
Get exclusive indicators & AI trading strategies: luxalgo.com
Free 150k+ community: discord.gg/lux
All content provided by LuxAlgo is for informational & educational purposes only. Past performance does not guarantee future results.
Free 150k+ community: discord.gg/lux
All content provided by LuxAlgo is for informational & educational purposes only. Past performance does not guarantee future results.
Wyłączenie odpowiedzialności
Informacje i publikacje nie stanowią i nie powinny być traktowane jako porady finansowe, inwestycyjne, tradingowe ani jakiekolwiek inne rekomendacje dostarczane lub zatwierdzone przez TradingView. Więcej informacji znajduje się w Warunkach użytkowania.
Skrypt open-source
W zgodzie z duchem TradingView twórca tego skryptu udostępnił go jako open-source, aby użytkownicy mogli przejrzeć i zweryfikować jego działanie. Ukłony dla autora. Korzystanie jest bezpłatne, jednak ponowna publikacja kodu podlega naszym Zasadom serwisu.
Get exclusive indicators & AI trading strategies: luxalgo.com
Free 150k+ community: discord.gg/lux
All content provided by LuxAlgo is for informational & educational purposes only. Past performance does not guarantee future results.
Free 150k+ community: discord.gg/lux
All content provided by LuxAlgo is for informational & educational purposes only. Past performance does not guarantee future results.
Wyłączenie odpowiedzialności
Informacje i publikacje nie stanowią i nie powinny być traktowane jako porady finansowe, inwestycyjne, tradingowe ani jakiekolwiek inne rekomendacje dostarczane lub zatwierdzone przez TradingView. Więcej informacji znajduje się w Warunkach użytkowania.