OPEN-SOURCE SCRIPT
Zaktualizowano RSI Zones
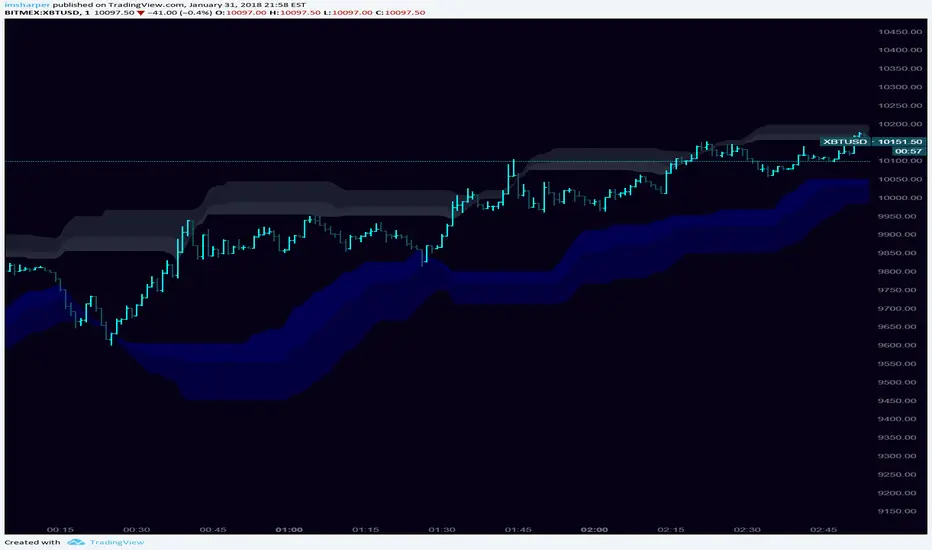
This is a combination of a couple ideas I saw on here. The result is from three configurable EMA smoothed RSI overbought/oversold zones. The default is set to Donchian Channel mode where the highs/lows of the RSI's are plotted. An optional basis line derived from the slowest RSI is also included. Toggling this mode off gives you different results.
You'll want to play with different lengths for your own preferences and to see what works best for you.
Being able to see price bounce between these zones should hopefully give you some ideas on how you could potentially use this.
Credit to LazyBear for the initial idea.
https://www.tradingview.com/script/zWq2YfzA-RSI-Bands-RSI-B-and-RSI-Bandwidth/
Informacje o Wersji
Added the ability to select source for the upper/lower zones for each RSI and defaulted things to high/low instead of close.Skrypt open-source
W zgodzie z duchem TradingView twórca tego skryptu udostępnił go jako open-source, aby użytkownicy mogli przejrzeć i zweryfikować jego działanie. Ukłony dla autora. Korzystanie jest bezpłatne, jednak ponowna publikacja kodu podlega naszym Zasadom serwisu.
Wyłączenie odpowiedzialności
Informacje i publikacje nie stanowią i nie powinny być traktowane jako porady finansowe, inwestycyjne, tradingowe ani jakiekolwiek inne rekomendacje dostarczane lub zatwierdzone przez TradingView. Więcej informacji znajduje się w Warunkach użytkowania.
Skrypt open-source
W zgodzie z duchem TradingView twórca tego skryptu udostępnił go jako open-source, aby użytkownicy mogli przejrzeć i zweryfikować jego działanie. Ukłony dla autora. Korzystanie jest bezpłatne, jednak ponowna publikacja kodu podlega naszym Zasadom serwisu.
Wyłączenie odpowiedzialności
Informacje i publikacje nie stanowią i nie powinny być traktowane jako porady finansowe, inwestycyjne, tradingowe ani jakiekolwiek inne rekomendacje dostarczane lub zatwierdzone przez TradingView. Więcej informacji znajduje się w Warunkach użytkowania.