OPEN-SOURCE SCRIPT
Zaktualizowano Daily Range

Hey traders,
at first thanks to the one and only Master Educator Stefan Kassing for sharing his legendary system with us!
And also credit to Mortdiggiddy, RootDuk and PineCoders for helping me with the script =)
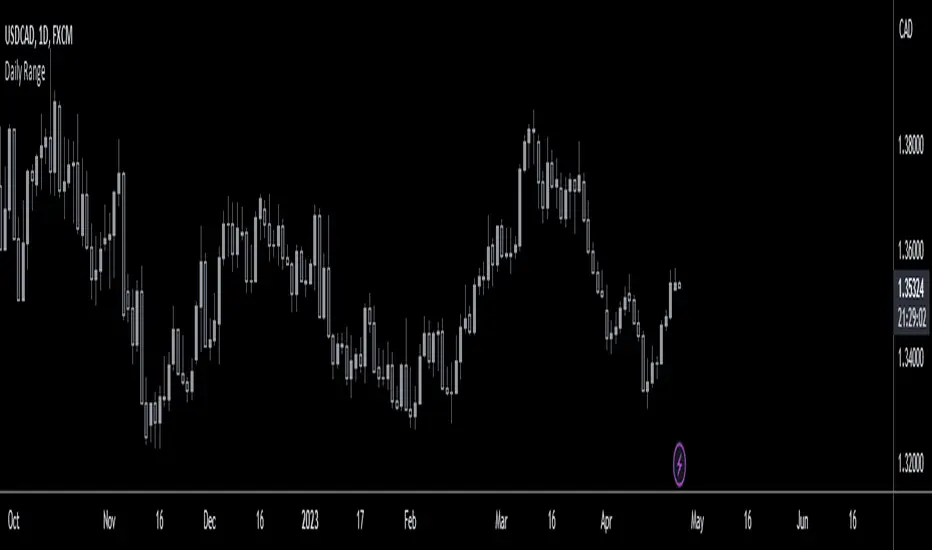
This script is calculating the daily range (in pips) of the current market you are in, in relation to the last 70 days (10 weeks).
It is used for a possible Take Profit in Stefan Kassing's System.
How to add the script to your chart:
1. Click "Add to Favorite Scripts"
-> i.imgur.com/DyGPaBz.png
2. Go in the Chart & click the little arrow in the upper bar and then click "Daily Range", then the Daily Range appears in the top left corner
-> i.imgur.com/fFl3W28.png
To avoid errors make sure to right-click the Y-Axis on the right side of the chart and then left-click "Scale Price Chart Only".
-> i.imgur.com/2UVA86u.png
Also be aware that the daily range is only showing up, if you are in the daily time interval or below and you are not hovering with the cursor over the past candles respectively above or below them.
If you are using this script in exotic currencypairs or uncommon other markets, the daily range can be incorrect or not showing up.
So don't hesitate contacting me, then I will try to add the markets that you want to.
To change the color or the decimal places of the number, you can click the gear in the upper left corner.
-> i.imgur.com/FA6Su7h.png
Happy Pips
Informacje o Wersji
The calculation is done in relation to the last 50 days, not 70 daysInformacje o Wersji
Fixed the calculation with crypto currenciesInformacje o Wersji
- Changed the script to PineScript version 5- Changed the calculation of the Daily Range
- Added an input field that allows the user to modify the number of days used in the calculation of the Daily Range (the default is 50)
If there are any issues with this version, and you have improvement suggestions, please let me know.
Skrypt open-source
W zgodzie z duchem TradingView twórca tego skryptu udostępnił go jako open-source, aby użytkownicy mogli przejrzeć i zweryfikować jego działanie. Ukłony dla autora. Korzystanie jest bezpłatne, jednak ponowna publikacja kodu podlega naszym Zasadom serwisu.
Wyłączenie odpowiedzialności
Informacje i publikacje nie stanowią i nie powinny być traktowane jako porady finansowe, inwestycyjne, tradingowe ani jakiekolwiek inne rekomendacje dostarczane lub zatwierdzone przez TradingView. Więcej informacji znajduje się w Warunkach użytkowania.