PROTECTED SOURCE SCRIPT
Flow Trend I: Trend Signals (with stop loss and invalidation)
Description
Flow Trend I is a Trend Following & Analysis indicator.
It attempts to characterize Long or Short trends to give a trader more confidence when opening a trade.
It can also be used as an analysis tool with no direct trading or investment in mind.
The calculation is based on Support & Resistance levels: S/R levels are calculated then we assume when price breaks out of a certain level, a new trend starts.
The indicator also provides other features:
Markets
This indicator has been designed for cryptocurrency markets in mind but is useful on trending markets in general. Avoid range bound markets (low timeframes, forex...) where trends are minimal and stop will be often hit. Avoid "low satoshi" coins (for example DOGE) as they break calculations: tight ranges make it difficult to see trends.
Entry
If the indicator shows a Blue (long) arrow, taking a long position is advised.
Open price reference is the close price of a confirmed candle marked by an arrow.
Stop Loss
Position Sizing is mandatory when following a trend indicator, the following can be applied to any indicator:
- Use the Green line (volatility stop) as the Stop Loss (if price goes lower, trade will be closed)
- Trades should be sized so a fixed % of a portfolio is lost in the event of a stop being hit (1%... 2%)
Stops are meant as protection only, they should not be hit often.
Exit
If there is a candle close under the Invalidation level (dotted line), close the trade.
If there is an opposite signal (for example: yellow candle while in a long trade), close or reduce position size.
As the trade progresses, you can move the stop loss up, following the green line to secure profits!
Take profit
No take profit points are provided explicitly.
More notes
- Scaling-in: it is interesting to build a position slowly to control risk. For example, if the position to open is 1000 units. Open 1/4 after a signal, then 1/4 the next day if the trend is still long (Blue) and so on until the position has been fully built.
- Configuration:
* Long/Short signals: they can be toggled in the script options to show Long only, Short only or both.
* Trend Confirmation: defines how many periods the algo waits before showing a signal. The default is 1, meaning, 1 candle is needed after a trend starts to show a signal. Lower values creates more signals, higher values less.
* Stop Loss Factor: increasing this will increase the stop distance (which in result will lower your position size)
- Multi timeframe analysis:
Use the indicator on multiple timeframes to get the big picture: what is the current trend on the weekly? then daily? then 4h?
There are trends within trends... Does it makes sense take risk shorting the 4h if there is a long trend on the daily?
* Position sizing calculation example:
- 1000$ portfolio, RISK per trade: 2%
- RISK = 2% of 1000 = 20$
- TSLA price is 500$
- Stop price: 450$
= SIZE: RISK / (Open Price - Stop Price) = 20 / (500 - 450) = 0.4 TSLA stock
Flow Trend I is a Trend Following & Analysis indicator.
It attempts to characterize Long or Short trends to give a trader more confidence when opening a trade.
It can also be used as an analysis tool with no direct trading or investment in mind.
The calculation is based on Support & Resistance levels: S/R levels are calculated then we assume when price breaks out of a certain level, a new trend starts.
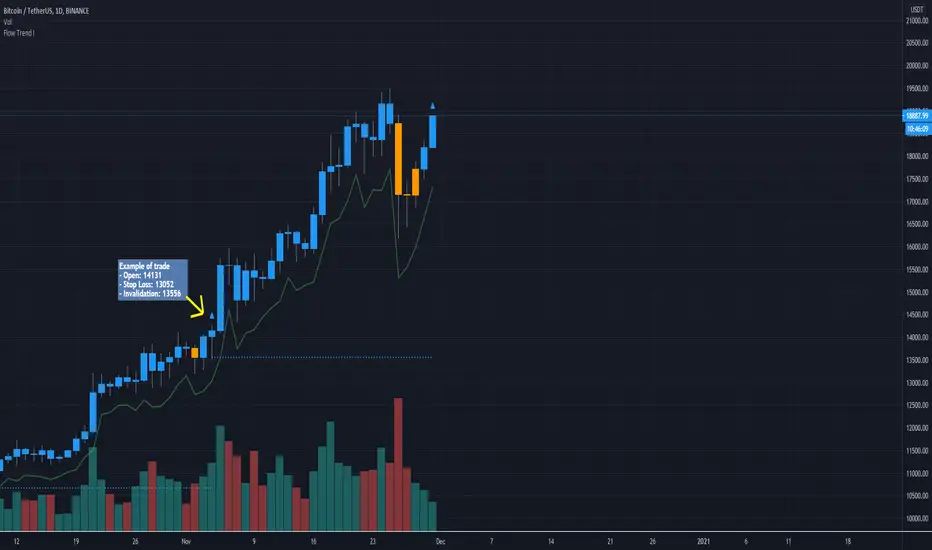
- Blue candle: LONG trend (positive returns)
- Orange candle: SHORT trend (negative returns)
- Grey candle: NEUTRAL trend (not conclusive, price within S/R levels)
The indicator also provides other features:
- Long/Short signals (arrows): a point to buy when a trend is confirmed
- Stop Loss Level (green line): volatility based stop loss
- Invalidation level (dotted lines): a point to exit the trade manually
Markets
This indicator has been designed for cryptocurrency markets in mind but is useful on trending markets in general. Avoid range bound markets (low timeframes, forex...) where trends are minimal and stop will be often hit. Avoid "low satoshi" coins (for example DOGE) as they break calculations: tight ranges make it difficult to see trends.
Entry
If the indicator shows a Blue (long) arrow, taking a long position is advised.
Open price reference is the close price of a confirmed candle marked by an arrow.
Stop Loss
Position Sizing is mandatory when following a trend indicator, the following can be applied to any indicator:
- Use the Green line (volatility stop) as the Stop Loss (if price goes lower, trade will be closed)
- Trades should be sized so a fixed % of a portfolio is lost in the event of a stop being hit (1%... 2%)
Stops are meant as protection only, they should not be hit often.
Exit
If there is a candle close under the Invalidation level (dotted line), close the trade.
If there is an opposite signal (for example: yellow candle while in a long trade), close or reduce position size.
As the trade progresses, you can move the stop loss up, following the green line to secure profits!
Take profit
No take profit points are provided explicitly.
More notes
- Scaling-in: it is interesting to build a position slowly to control risk. For example, if the position to open is 1000 units. Open 1/4 after a signal, then 1/4 the next day if the trend is still long (Blue) and so on until the position has been fully built.
- Configuration:
* Long/Short signals: they can be toggled in the script options to show Long only, Short only or both.
* Trend Confirmation: defines how many periods the algo waits before showing a signal. The default is 1, meaning, 1 candle is needed after a trend starts to show a signal. Lower values creates more signals, higher values less.
* Stop Loss Factor: increasing this will increase the stop distance (which in result will lower your position size)
- Multi timeframe analysis:
Use the indicator on multiple timeframes to get the big picture: what is the current trend on the weekly? then daily? then 4h?
There are trends within trends... Does it makes sense take risk shorting the 4h if there is a long trend on the daily?
* Position sizing calculation example:
- 1000$ portfolio, RISK per trade: 2%
- RISK = 2% of 1000 = 20$
- TSLA price is 500$
- Stop price: 450$
= SIZE: RISK / (Open Price - Stop Price) = 20 / (500 - 450) = 0.4 TSLA stock
Skrypt chroniony
Ten skrypt został opublikowany jako zamknięty kod źródłowy. Można z tego korzystać swobodnie i bez żadnych ograniczeń — więcej informacji znajduje się tutaj.
Wyłączenie odpowiedzialności
Informacje i publikacje nie stanowią i nie powinny być traktowane jako porady finansowe, inwestycyjne, tradingowe ani jakiekolwiek inne rekomendacje dostarczane lub zatwierdzone przez TradingView. Więcej informacji znajduje się w Warunkach użytkowania.