OPEN-SOURCE SCRIPT
Relative Strength Market Picker
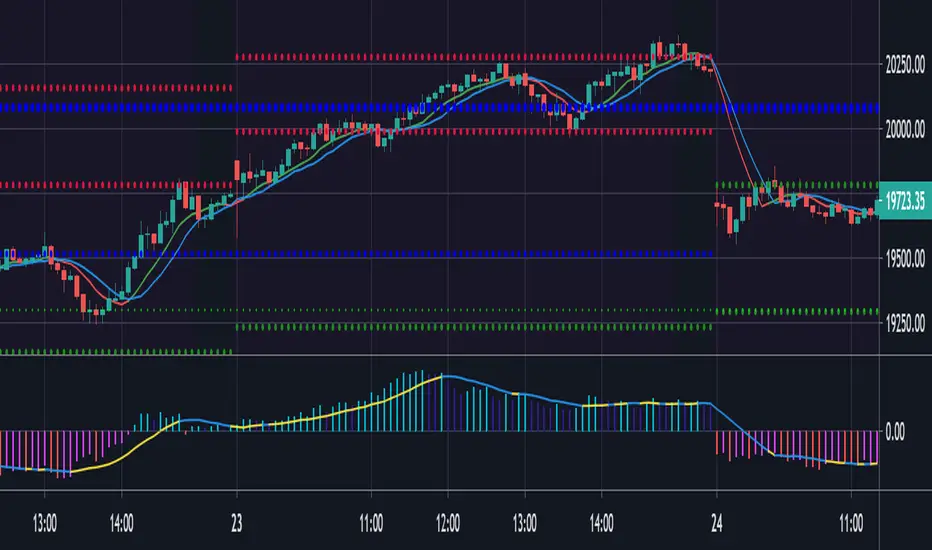
Modified to code from modhelius and added colors and histogram for easy reading...thanks to him...
What is Relative Strength?
Relative strength is a ratio of a stock price performance to a market average (index) performance. It is used in technical analysis.
It is not to be confused with relative strength index.
To calculate the relative strength of a particular stock, divide the percentage change over some time period by the percentage change of a particular index over the same time period.
How to read this indicator for trading and decesion making?
There are four colors
Aqua: Shows the bullish momentum against the index of your choosing
Navy blue: Show the bearish momentum is weakning at the time period
Fuschsia : Shows the bullish gaining strength and about to cross zero line
Red: Shows the bearish momentum is strong.
Other indicators to be used along with this are
1. Pivot points
2. Moving Average of highs and lows -- 17 period
To take long calls --- There has to be high closing candle above the 17 period moving average of highs and there has to be bullish momentum and ideally with the pivot point as a support
To take short calls -- There has to low closing candle below the 17 period moving average of lows and there has to be bearish momentum and ideally with the pivot point as a resistance.
Skrypt open-source
W zgodzie z duchem TradingView twórca tego skryptu udostępnił go jako open-source, aby użytkownicy mogli przejrzeć i zweryfikować jego działanie. Ukłony dla autora. Korzystanie jest bezpłatne, jednak ponowna publikacja kodu podlega naszym Zasadom serwisu.
Wyłączenie odpowiedzialności
Informacje i publikacje nie stanowią i nie powinny być traktowane jako porady finansowe, inwestycyjne, tradingowe ani jakiekolwiek inne rekomendacje dostarczane lub zatwierdzone przez TradingView. Więcej informacji znajduje się w Warunkach użytkowania.