OPEN-SOURCE SCRIPT
Stoch + RSI Oscillator @shrilss
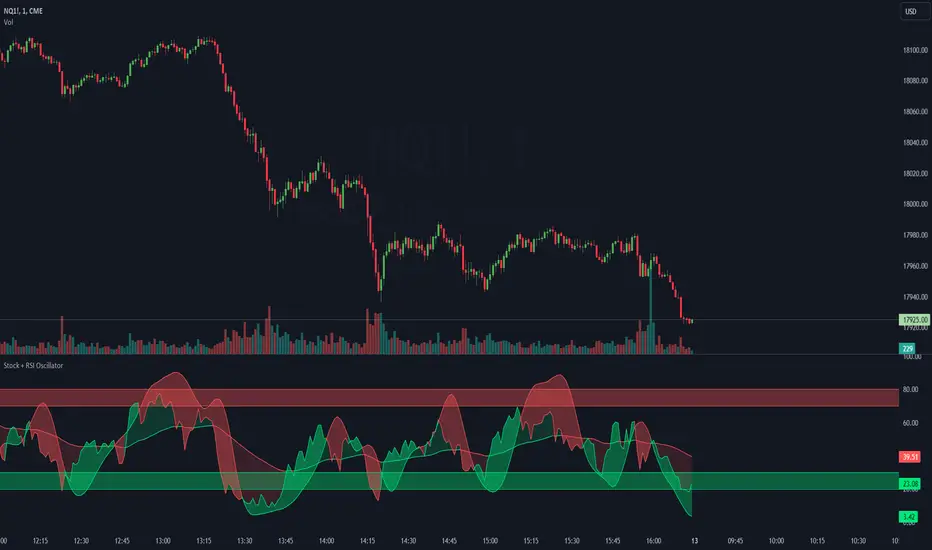
This script combines two powerful indicators, the Stochastic Oscillator and the Relative Strength Index (RSI), to offer traders a comprehensive view of market dynamics.
The Stochastic Oscillator, known for its effectiveness in identifying overbought and oversold conditions, is enhanced here with a smoothing mechanism to provide clearer signals. The script calculates the %K and %D lines of the Stochastic Oscillator, then applies a smoothing factor to %K, resulting in a smoother representation of price momentum.
Simultaneously, the RSI component offers insights into the strength of price movements. By comparing the average gains and losses over a specified period, it provides a measure of bullish and bearish sentiment within the market.
This script's innovation lies in its integration of these two indicators. The Stochastic Oscillator's smoothed %K line and the RSI are compared to dynamic thresholds, enabling traders to identify potential trend reversals and confirmations more effectively. When the RSI crosses above or below the Stochastic %D line, it can signal potential shifts in market momentum.
Skrypt open-source
W zgodzie z duchem TradingView twórca tego skryptu udostępnił go jako open-source, aby użytkownicy mogli przejrzeć i zweryfikować jego działanie. Ukłony dla autora. Korzystanie jest bezpłatne, jednak ponowna publikacja kodu podlega naszym Zasadom serwisu.
Wyłączenie odpowiedzialności
Informacje i publikacje nie stanowią i nie powinny być traktowane jako porady finansowe, inwestycyjne, tradingowe ani jakiekolwiek inne rekomendacje dostarczane lub zatwierdzone przez TradingView. Więcej informacji znajduje się w Warunkach użytkowania.