OPEN-SOURCE SCRIPT
Multiple Timeframe continuity with Crossover Alerts
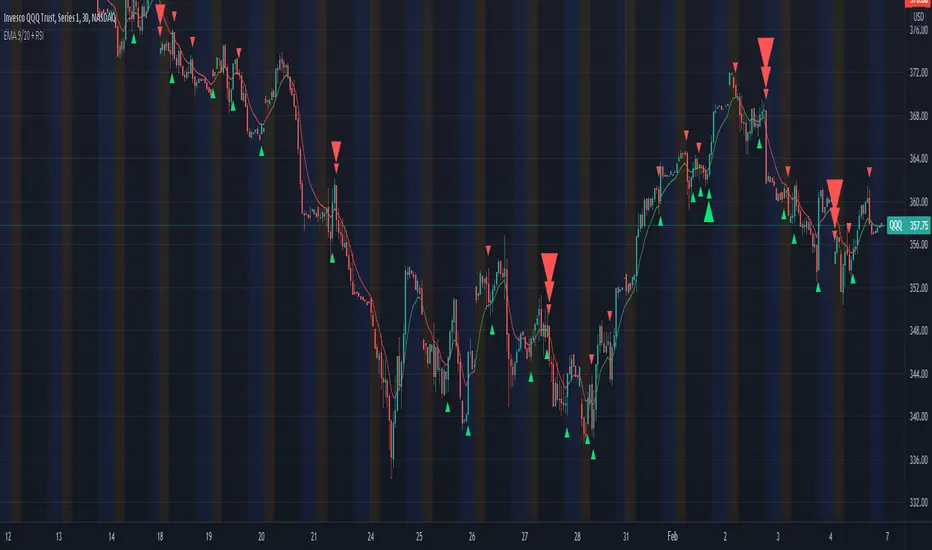
█ OVERVIEW
This Indicator calculates the EMA 9/20 and the RSI with its SMA on multiple timeframes and indicates their crossings. In addition this script alerts the user when crossings appear.
█ USAGE
Use the checkboxes to activate different timeframes. With the dropdown menu you can select the timeframe in minutes.
Furthermroie use the checkboxes to activate different crossovers. At the end of the settings you can find the same options for the RSI.
You can also let the script indicate only the overlapping of both indicator crossovers by using the combination option.
█ KNOWLEDGE
EMA: The ema function returns the exponentially weighted moving average. In ema weighting factors decrease exponentially. It calculates by using a formula: EMA = alpha * source + (1 - alpha) * EMA[1], where alpha = 2 / (length + 1).
SMA: The sma function returns the moving average, that is the sum of last y values of x, divided by y.
RSI: The RSI is classified as a momentum oscillator, measuring the velocity and magnitude of price movements. Momentum is the rate of the rise or fall in price. The RSI computes momentum as the ratio of higher closes to lower closes: stocks which have had more or stronger positive changes have a higher RSI than stocks which have had more or stronger negative changes.
RMA: Moving average used in RSI. It is the exponentially weighted moving average with alpha = 1 / length.
(Source: TradingView PineScript reference & en.wikipedia.org/wiki/Relative_strength_index)
█ Credits
Thanks to KhanPhelan with his EMA 9/20 trading idea
Credits to TradingView for their RSI function
█ Disclaimer
This is my first Script, any feedback is welcome.
Skrypt open-source
W zgodzie z duchem TradingView twórca tego skryptu udostępnił go jako open-source, aby użytkownicy mogli przejrzeć i zweryfikować jego działanie. Ukłony dla autora. Korzystanie jest bezpłatne, jednak ponowna publikacja kodu podlega naszym Zasadom serwisu.
Wyłączenie odpowiedzialności
Informacje i publikacje nie stanowią i nie powinny być traktowane jako porady finansowe, inwestycyjne, tradingowe ani jakiekolwiek inne rekomendacje dostarczane lub zatwierdzone przez TradingView. Więcej informacji znajduje się w Warunkach użytkowania.