OPEN-SOURCE SCRIPT
Zaktualizowano Daily Moving Averages Oscillator
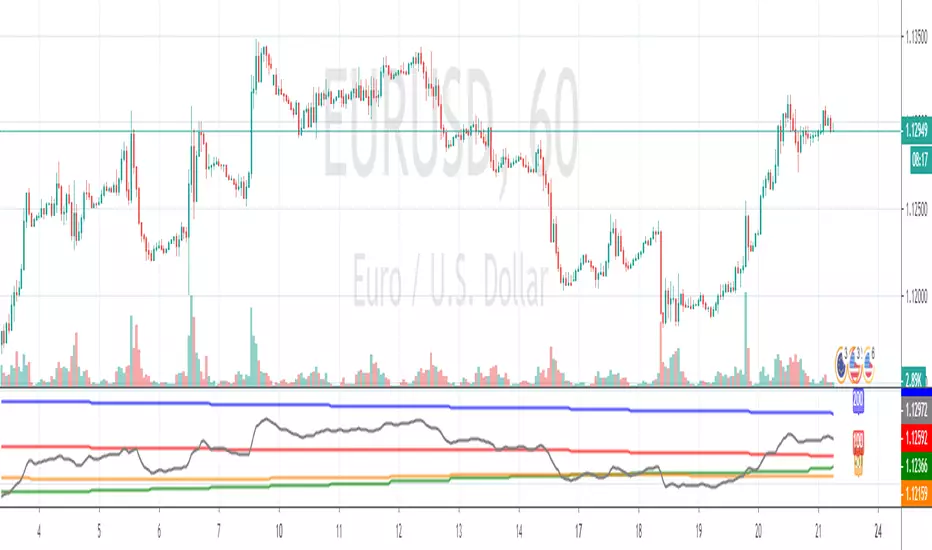
This is the best way I've found so far for gauging directional bias (i.e. overall trend) at-a-glance. It shows current price in black along with the 20, 50 & 100 daily MAs, all of which are visible at all times, and from all timeframes. No wondering where the 100MA is cause it's now showing on the chart. I also find this good for keeping my charts visually cleaner. Having the undulating lines moved underneath makes it easier for me to see support/resistance and other imporant stuff,
The trend is your friend and this helps to make sure you're on the right side of a trade.
The trend is your friend and this helps to make sure you're on the right side of a trade.
Informacje o Wersji
Fixed screenshotInformacje o Wersji
Added 200MA in blue, and 50 period Kijun (which is like a dynamic 50% fib) in brown, added some new options for hiding and offsetting the labelsSkrypt open-source
W zgodzie z duchem TradingView twórca tego skryptu udostępnił go jako open-source, aby użytkownicy mogli przejrzeć i zweryfikować jego działanie. Ukłony dla autora. Korzystanie jest bezpłatne, jednak ponowna publikacja kodu podlega naszym Zasadom serwisu.
Wyłączenie odpowiedzialności
Informacje i publikacje nie stanowią i nie powinny być traktowane jako porady finansowe, inwestycyjne, tradingowe ani jakiekolwiek inne rekomendacje dostarczane lub zatwierdzone przez TradingView. Więcej informacji znajduje się w Warunkach użytkowania.
Skrypt open-source
W zgodzie z duchem TradingView twórca tego skryptu udostępnił go jako open-source, aby użytkownicy mogli przejrzeć i zweryfikować jego działanie. Ukłony dla autora. Korzystanie jest bezpłatne, jednak ponowna publikacja kodu podlega naszym Zasadom serwisu.
Wyłączenie odpowiedzialności
Informacje i publikacje nie stanowią i nie powinny być traktowane jako porady finansowe, inwestycyjne, tradingowe ani jakiekolwiek inne rekomendacje dostarczane lub zatwierdzone przez TradingView. Więcej informacji znajduje się w Warunkach użytkowania.