OPEN-SOURCE SCRIPT
Zaktualizowano Ehlers Discrete Fourier Transform

The Discrete Fourier Transform Indicator was written by John Ehlers and more details can be found at https://www.mesasoftware.com/papers/FourierTransformForTraders.pdf
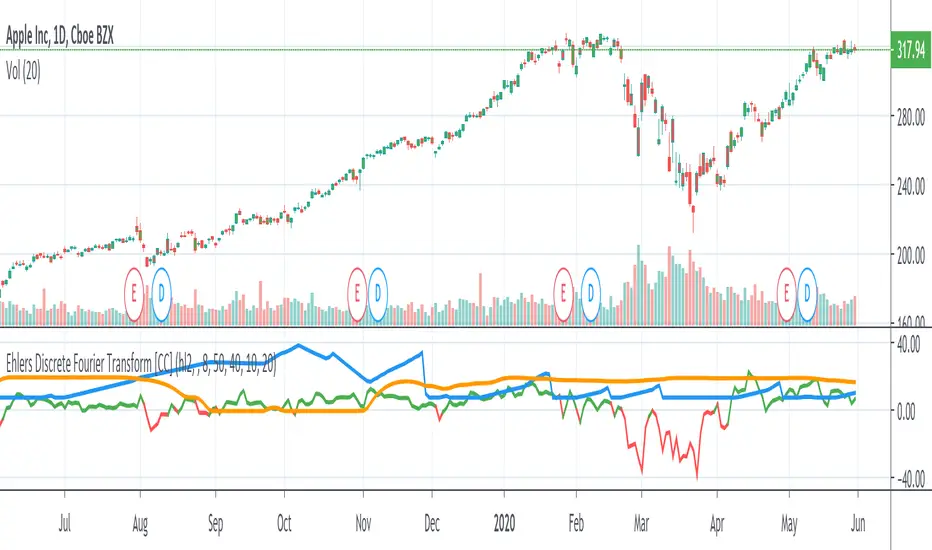
I have color coded everything as follows: blue line is the dominant cycle, orange line is the power converted to decibels, and I have marked the other line as red if you should sell or green if you should buy
Let me know if you would like to see me write any other scripts!
I have color coded everything as follows: blue line is the dominant cycle, orange line is the power converted to decibels, and I have marked the other line as red if you should sell or green if you should buy
Let me know if you would like to see me write any other scripts!
Informacje o Wersji
updated to match my other indicatorsInformacje o Wersji
fixed issue with default resolutionSkrypt open-source
W zgodzie z duchem TradingView twórca tego skryptu udostępnił go jako open-source, aby użytkownicy mogli przejrzeć i zweryfikować jego działanie. Ukłony dla autora. Korzystanie jest bezpłatne, jednak ponowna publikacja kodu podlega naszym Zasadom serwisu.
Wyłączenie odpowiedzialności
Informacje i publikacje nie stanowią i nie powinny być traktowane jako porady finansowe, inwestycyjne, tradingowe ani jakiekolwiek inne rekomendacje dostarczane lub zatwierdzone przez TradingView. Więcej informacji znajduje się w Warunkach użytkowania.
Skrypt open-source
W zgodzie z duchem TradingView twórca tego skryptu udostępnił go jako open-source, aby użytkownicy mogli przejrzeć i zweryfikować jego działanie. Ukłony dla autora. Korzystanie jest bezpłatne, jednak ponowna publikacja kodu podlega naszym Zasadom serwisu.
Wyłączenie odpowiedzialności
Informacje i publikacje nie stanowią i nie powinny być traktowane jako porady finansowe, inwestycyjne, tradingowe ani jakiekolwiek inne rekomendacje dostarczane lub zatwierdzone przez TradingView. Więcej informacji znajduje się w Warunkach użytkowania.