OPEN-SOURCE SCRIPT
Zaktualizowano Multi-Timeframe EMAs
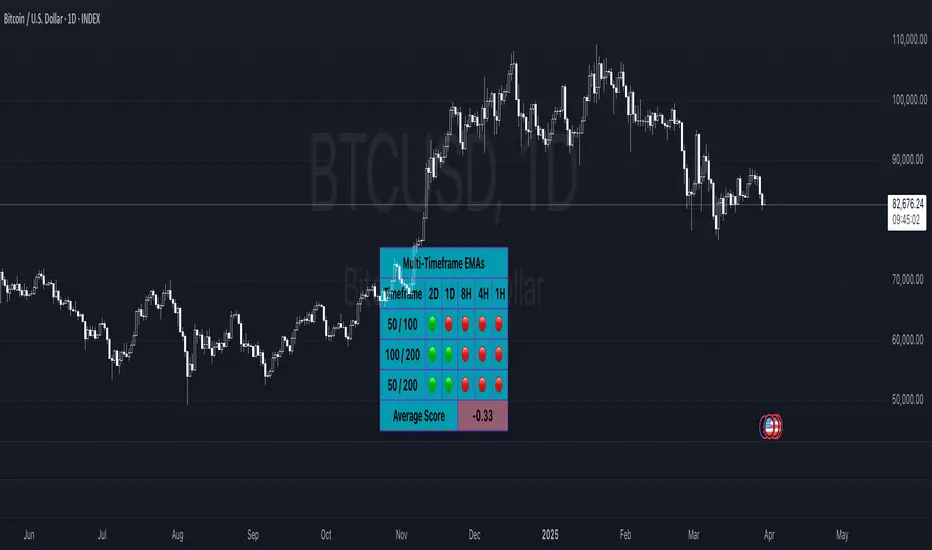
Multi Timeframe EMA's
The 'Multi-Timeframe EMA Band Comparison' indicator is a tool designed to analyze trend direction across multiple timeframes using Exponential Moving Averages. it calculates the 50, 100, and 200 period EMAs for fiver user defined timeframes and compares their relationships to provide a visual snapshot of bullish or bearish momentum.
How it Works:
Average Score:
An overall average score is calculated across all 15 comparisons ranging from 1 to -1, displayed with two decimal places and color coded.
Customization:
This indicator is fully customizable from the timeframe setting to the color of the table. The only specific part that is not changeable is the EMA bands.
The 'Multi-Timeframe EMA Band Comparison' indicator is a tool designed to analyze trend direction across multiple timeframes using Exponential Moving Averages. it calculates the 50, 100, and 200 period EMAs for fiver user defined timeframes and compares their relationships to provide a visual snapshot of bullish or bearish momentum.
How it Works:
- EMA Calculations: For each selected timeframe, the indicator computes the 50, 100, and 200 period EMAs based on the closing price.
- Band Comparisons: Three key relationships are evaluated:
- 50 EMA vs 100 EMA
- 100 EMA vs 200 EMA
- 50 EMA vs 200 EMA
- Scoring System: Each comparison is assigned a score:
- 🟢 (Green Circle): The shorter EMA is above the longer EMA, signaling bullish momentum.
- 🔴 (Red Circle): The shorter EMA is below the longer EMA, signaling bearish momentum.
- ⚪️ (White Circle): The EMAs are equal or data is unavailable (rare).
Average Score:
An overall average score is calculated across all 15 comparisons ranging from 1 to -1, displayed with two decimal places and color coded.
Customization:
This indicator is fully customizable from the timeframe setting to the color of the table. The only specific part that is not changeable is the EMA bands.
Informacje o Wersji
Dynamic Inputs for the lengths have been added. Informacje o Wersji
- Updated boolean to show EMA lengths for selected lengthsSkrypt open-source
W zgodzie z duchem TradingView twórca tego skryptu udostępnił go jako open-source, aby użytkownicy mogli przejrzeć i zweryfikować jego działanie. Ukłony dla autora. Korzystanie jest bezpłatne, jednak ponowna publikacja kodu podlega naszym Zasadom serwisu.
Wyłączenie odpowiedzialności
Informacje i publikacje nie stanowią i nie powinny być traktowane jako porady finansowe, inwestycyjne, tradingowe ani jakiekolwiek inne rekomendacje dostarczane lub zatwierdzone przez TradingView. Więcej informacji znajduje się w Warunkach użytkowania.
Skrypt open-source
W zgodzie z duchem TradingView twórca tego skryptu udostępnił go jako open-source, aby użytkownicy mogli przejrzeć i zweryfikować jego działanie. Ukłony dla autora. Korzystanie jest bezpłatne, jednak ponowna publikacja kodu podlega naszym Zasadom serwisu.
Wyłączenie odpowiedzialności
Informacje i publikacje nie stanowią i nie powinny być traktowane jako porady finansowe, inwestycyjne, tradingowe ani jakiekolwiek inne rekomendacje dostarczane lub zatwierdzone przez TradingView. Więcej informacji znajduje się w Warunkach użytkowania.