OPEN-SOURCE SCRIPT
Duong_Sideway Zone

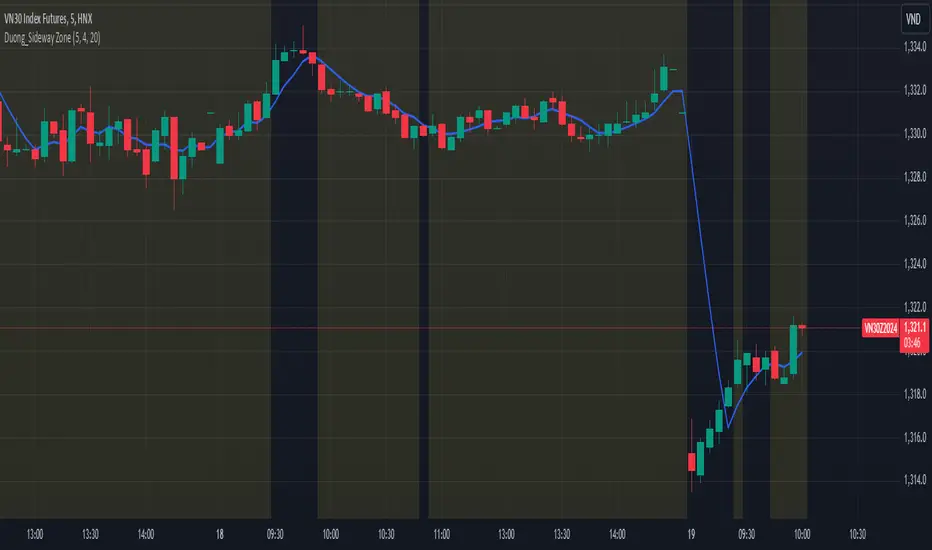
This indicator is designed to identify sideway (ranging) zones on the price chart. It uses a Moving Average (MA) and criteria such as the number of price crosses over the MA, as well as breakout checks, to determine whether the market is in a sideway state. When a sideway zone is detected, it is highlighted with a yellow background on the chart.
Key Features:
MA Line: Uses a Moving Average (MA) as the basis for trend identification.
Sideway Threshold: Based on the number of price crosses over the MA within a specific period.
Breakout Check: Excludes zones from being considered sideway if a breakout occurs beyond the ATR threshold.
Visual Highlighting: Highlights sideway zones with a yellow background for easy identification.
This indicator is ideal for traders looking to identify ranging market phases to adjust their trading strategies accordingly.
For example, if within the last 20 candles, the number of times the closing price crosses the MA5 is greater than 4, it is considered a sideway zone, except in cases where the closing price of a recent candle has broken out of the highest/ lowest price of the previous 20 candles.
Skrypt open-source
W zgodzie z duchem TradingView twórca tego skryptu udostępnił go jako open-source, aby użytkownicy mogli przejrzeć i zweryfikować jego działanie. Ukłony dla autora. Korzystanie jest bezpłatne, jednak ponowna publikacja kodu podlega naszym Zasadom serwisu.
Wyłączenie odpowiedzialności
Informacje i publikacje nie stanowią i nie powinny być traktowane jako porady finansowe, inwestycyjne, tradingowe ani jakiekolwiek inne rekomendacje dostarczane lub zatwierdzone przez TradingView. Więcej informacji znajduje się w Warunkach użytkowania.