OPEN-SOURCE SCRIPT
One Year Return
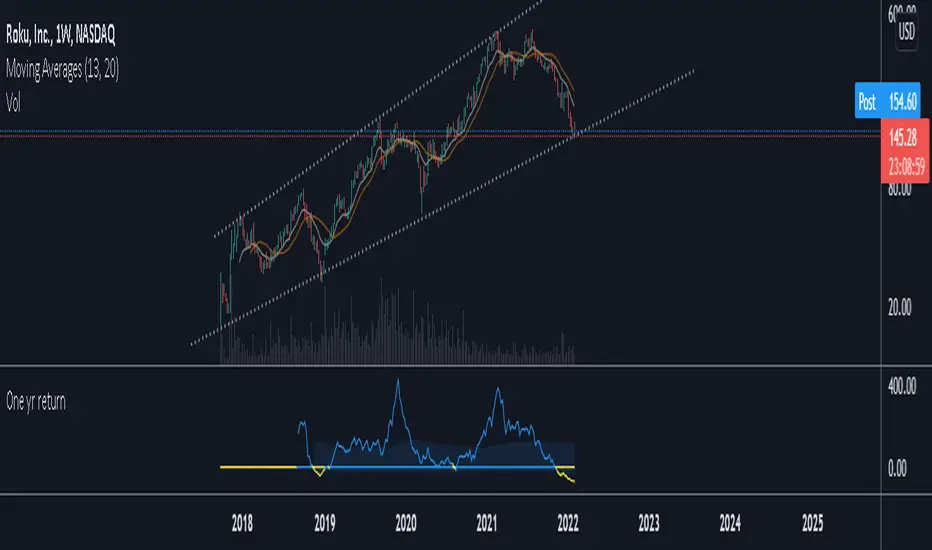
This is a script meant for the weekly timeframe . It shows the change between the current close and the close 52 bars ago. I find that this data can be useful for deciding how long to stay in a trade, and for deciding how far a stock is likely to move in a year based on it's historical returns. The High average takes the sum of all positive returns and averages it using the number of bars where the data was positive, the low average does the same but with all the returns below zero. When both are turned on you will see a band between these values.
Skrypt open-source
W zgodzie z duchem TradingView twórca tego skryptu udostępnił go jako open-source, aby użytkownicy mogli przejrzeć i zweryfikować jego działanie. Ukłony dla autora. Korzystanie jest bezpłatne, jednak ponowna publikacja kodu podlega naszym Zasadom serwisu.
Wyłączenie odpowiedzialności
Informacje i publikacje nie stanowią i nie powinny być traktowane jako porady finansowe, inwestycyjne, tradingowe ani jakiekolwiek inne rekomendacje dostarczane lub zatwierdzone przez TradingView. Więcej informacji znajduje się w Warunkach użytkowania.