OPEN-SOURCE SCRIPT
Volatility
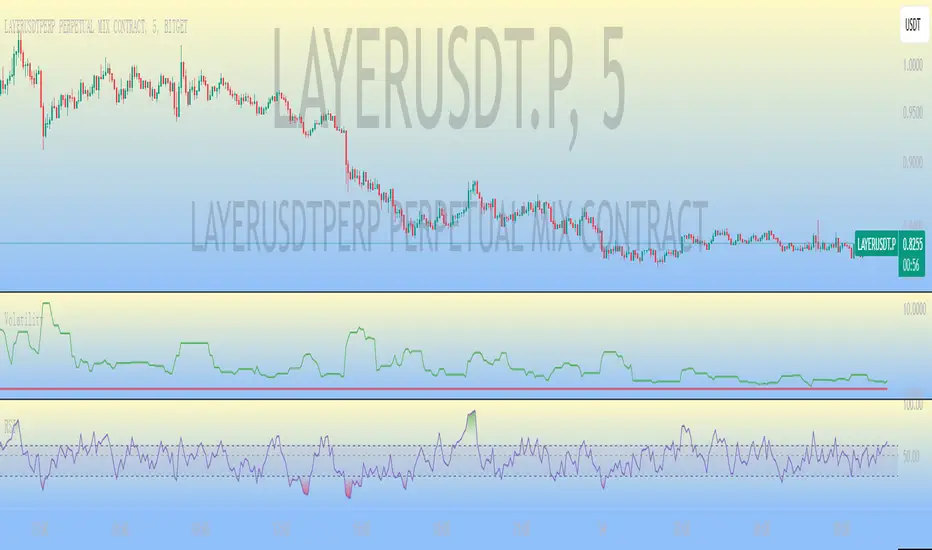
This is a filtering indicator Volatility in the CTA contract of BG Exchange. According to their introduction, it should be calculated using this simple method.
However, you may have seen the problem. According to the exchange's introduction, the threshold should still be divided by 100, which is in percentage form. The result I calculated, even if not divided by 100, still shows a significant difference, which may be due to the exchange's mistake. Smart netizens, do you know how the volatility of BG Exchange is calculated.
The official introduction of BG Exchange is as follows: Volatility (K, Fluctuation) is an additional indicator used to filter out positions triggered by CTA strategy signals in low volatility markets. Usage: Select the fluctuation range composed of the nearest K candlesticks, and choose the highest and lowest closing prices. Calculation: 100 * (highest closing price - lowest closing price) divided by the lowest closing price to obtain the recent amplitude. When the recent amplitude is greater than Fluctuation, it is considered that the current market volatility meets the requirements. When the CTA strategy's position building signal is triggered, position building can be executed. Otherwise, warehouse building cannot be executed.
Skrypt open-source
W zgodzie z duchem TradingView twórca tego skryptu udostępnił go jako open-source, aby użytkownicy mogli przejrzeć i zweryfikować jego działanie. Ukłony dla autora. Korzystanie jest bezpłatne, jednak ponowna publikacja kodu podlega naszym Zasadom serwisu.
Wyłączenie odpowiedzialności
Informacje i publikacje nie stanowią i nie powinny być traktowane jako porady finansowe, inwestycyjne, tradingowe ani jakiekolwiek inne rekomendacje dostarczane lub zatwierdzone przez TradingView. Więcej informacji znajduje się w Warunkach użytkowania.