OPEN-SOURCE SCRIPT
GP - Long Short Scanner
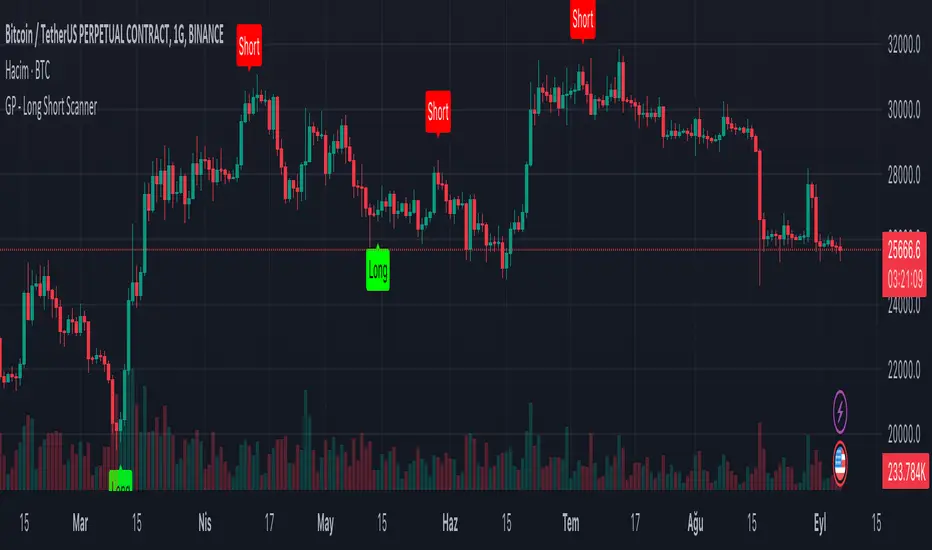
This script is made to predict the point at which price-time charts will rise or fall. The script was inspired by the RSI and TSI formulas. The formula is simply; Calculates the RSI and TSI values of open, high, low and close. Calculated values are converted to an array. The maximum and minimum values in the array are taken for the candles included in the calculation. These values calculate the time when the "Long" label will be seen on the chart of the candle that will increase the price. At the same time, it calculates the time when the "Short" label will appear on the chart of the candle that will decrease the price. Although these calculations are not precise; Seeing the “Long” label means that the price will rise at that candle, and seeing the “Short” label means that the price will decrease at that candle. The “Long”, “Short” tags from this script alone should not be used to determine the direction of the price. It can be used on all price-time charts.
Skrypt open-source
W zgodzie z duchem TradingView twórca tego skryptu udostępnił go jako open-source, aby użytkownicy mogli przejrzeć i zweryfikować jego działanie. Ukłony dla autora. Korzystanie jest bezpłatne, jednak ponowna publikacja kodu podlega naszym Zasadom serwisu.
Wyłączenie odpowiedzialności
Informacje i publikacje nie stanowią i nie powinny być traktowane jako porady finansowe, inwestycyjne, tradingowe ani jakiekolwiek inne rekomendacje dostarczane lub zatwierdzone przez TradingView. Więcej informacji znajduje się w Warunkach użytkowania.