PROTECTED SOURCE SCRIPT
Delta Volume Moves

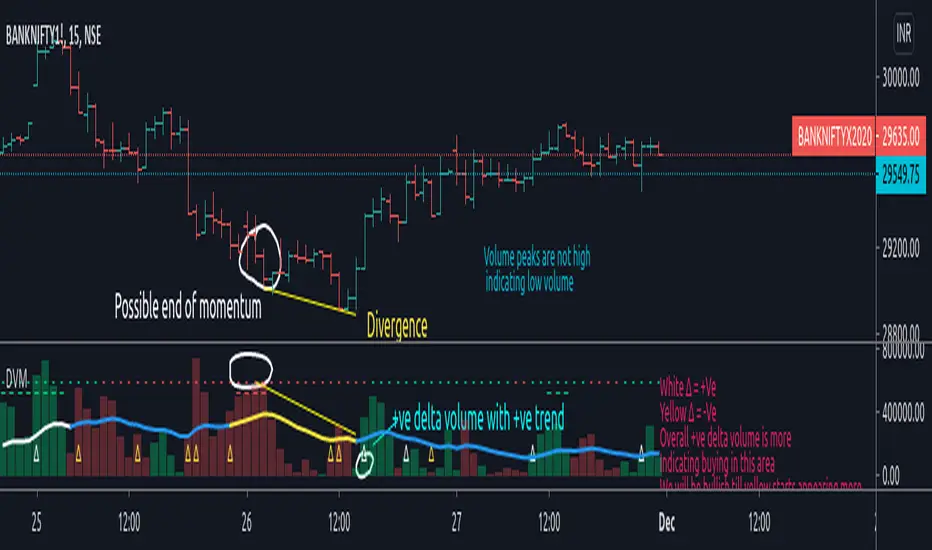
Today I propose an indicator to measure volume trend and change in buying and selling pressure (Delta). This is a synthetic mechanism to derive delta volume and then formulate rest so its not like typical delta volume indicator either.
So what is it exactly?
Indicator first calculates the cumulative delta volume , then filters it through filters applied in the calculation to identify major volume changes/pressure change, it also keeps track of overall trend based on 20 SMA filter as basis and 2 stdv movement from it applied on cumulative delta volume . This is plotted on top side of the indicator with "-" and "_" plots. Color lime indicates bullish trend and color red indicates bearish trend .
Delta filter is dependent on the factor input which is user defined, here by default it is 1.5, which will indicate overall significant change in pressure in volume in that particular direction, please note that higher the number lower the delta plots you will have to count it, and number below 1 would be useless as it would not be measuring "increase" in delta volume but decrease. So it is advised to keep it around 1.5 to be reasonably useful measure. This is plotted with "∆" character on the volume bars.
How can we use this to our advantage?
As you can see on chart, its able to identify possible reversal or tops/bottoms of the price action, while this is the primary use it is also worth noting that in comparison to the regular volume indicator which is dependent on the candle price close with respect to its open, this is much better visual representation of the sell or buy volume .
When you apply delta filters and trend filters to an already easy to read volume indicator, it is making significant impact on indicators ability to identify major volume changes and trend changes with respect to cumulative delta volume .
Authors note:
Please note that this study is experimental and published for the educational purpose, if you decide to use it to monitor market it is advised that you put in some time to observe correlations between this and price action before you start trading it.
Also, while on chart this is showing impressive tendency to identify tops and bottoms, its a very limited view. Please keep in mind to check this across different scripts which have good qty of volume .
Author takes no responsibility of your loss or profit from this.
Past performance is no assurance of future performance.
Regards.
Skrypt chroniony
Ten skrypt został opublikowany jako zamknięty kod źródłowy. Można z tego korzystać swobodnie i bez żadnych ograniczeń — więcej informacji znajduje się tutaj.
“There are those who think they are studying the market—when all they are doing is studying what someone has said about the market . . . not what the market has said about itself.”
Wyłączenie odpowiedzialności
Informacje i publikacje nie stanowią i nie powinny być traktowane jako porady finansowe, inwestycyjne, tradingowe ani jakiekolwiek inne rekomendacje dostarczane lub zatwierdzone przez TradingView. Więcej informacji znajduje się w Warunkach użytkowania.