OPEN-SOURCE SCRIPT
Qualitative and Quantitative Candlestick Score [CHE]
Qualitative and Quantitative Candlestick Score [CHE]
Overview
The Qualitative and Quantitative Candlestick Score [CHE] is a powerful indicator for TradingView that combines both qualitative and quantitative analyses of candlestick patterns. This indicator provides traders with a comprehensive assessment of market conditions to make informed trading decisions.
Key Features
- Quantitative Analysis: Calculates a quantitative score based on the price movement of each candle.
- Qualitative Analysis: Evaluates candles based on body size, wick size, trend, and trading volume.
- Cumulative Scores: Displays cumulative green (bullish) and red (bearish) scores over a defined period.
- Trend Analysis: Identifies trend direction, strength, and provides trading recommendations (Long/Short).
- Customizable Settings: Adjust parameters for time periods, thresholds, and volume analysis.
Settings and Customizations
1. Time Period Settings:
- Period: Number of periods to calculate moving averages and cumulative scores (Default: 14).
2. Qualitative Evaluation:
- Body Size Threshold (%): Minimum size of the candle body to be considered significant (Default: 0.5%).
- Wick Size Threshold (%): Maximum size of the wicks to be considered minimal (Default: 0.3%).
3. Volume Settings:
- Include Volume in Evaluation: Whether to include trading volume in the qualitative score (Default: Enabled).
- Volume MA Period: Number of periods to calculate the moving average of volume (Default: 14).
4. Trend Settings:
- Moving Average Length: Number of periods for the Simple Moving Average used to determine the trend (Default: 50).
Calculations and Visualizations
- Quantitative Score: Difference between the closing and opening price, normalized to the opening price.
- Qualitative Score: Evaluation based on body size, wick size, trend, and volume.
- Cumulative Scores: Average of green and red scores over the defined period.
- Score Difference: Difference between cumulative green and red scores to determine trend direction.
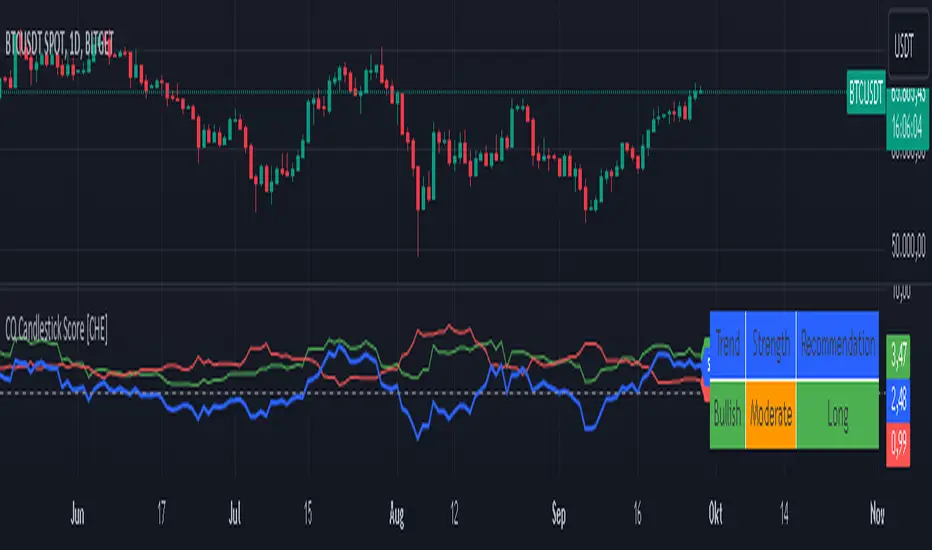
- Trend Analysis Table: Displays trend direction, trend strength, and trading recommendation in an easy-to-read table.
Plotting and Display
- Cumulative Scores: Displays cumulative green and red scores in green and red colors.
- Score Difference: Blue line chart to visualize the difference between green and red scores.
- Zero Line: Horizontal gray line as a reference point.
- Trend Analysis Table: Table in the top right of the chart showing current trend direction, strength, and trading recommendation.
Use Cases
- Trend Identification: Use the score difference and trend analysis table to quickly assess the current market sentiment.
- Trading Recommendations: Based on the table, decide whether a long or short entry is appropriate.
- Volume Analysis: Including volume helps to better understand the strength of a trend.
Benefits
- Comprehensive Analysis: Combines quantitative and qualitative methods for a deeper market analysis.
- User-Friendly: Easy parameter adjustments allow for personalized use.
- Visually Appealing: Clear charts and tables facilitate data interpretation.
- Flexible: Adaptable to various trading strategies and timeframes.
Installation and Usage
1. Installation:
- Copy the provided Pine Script code.
- Go to TradingView and open the Pine Script Editor.
- Paste the code and save the script.
- Add the indicator to your chart.
2. Customization:
- Adjust the parameters according to your trading preferences.
- Monitor the cumulative scores and the trend analysis table for trading decisions.
Conclusion
The Qualitative and Quantitative Candlestick Score [CHE] offers a comprehensive analysis of market conditions by combining quantitative and qualitative evaluation methods. With its user-friendly settings and clear visualizations, this indicator is a valuable tool for traders seeking informed and precise trading decisions.
Best regards and happy trading
Chervolino
Developed by: Chervolino
Version: 1.0
License: Free to use and customize on TradingView.
For any questions or feedback, feel free to contact me through the TradingView community.
Note: This indicator is a tool to assist with trading decisions and does not replace professional financial advice. Use it responsibly and thoroughly test it before incorporating it into your trading strategies.
Overview
The Qualitative and Quantitative Candlestick Score [CHE] is a powerful indicator for TradingView that combines both qualitative and quantitative analyses of candlestick patterns. This indicator provides traders with a comprehensive assessment of market conditions to make informed trading decisions.
Key Features
- Quantitative Analysis: Calculates a quantitative score based on the price movement of each candle.
- Qualitative Analysis: Evaluates candles based on body size, wick size, trend, and trading volume.
- Cumulative Scores: Displays cumulative green (bullish) and red (bearish) scores over a defined period.
- Trend Analysis: Identifies trend direction, strength, and provides trading recommendations (Long/Short).
- Customizable Settings: Adjust parameters for time periods, thresholds, and volume analysis.
Settings and Customizations
1. Time Period Settings:
- Period: Number of periods to calculate moving averages and cumulative scores (Default: 14).
2. Qualitative Evaluation:
- Body Size Threshold (%): Minimum size of the candle body to be considered significant (Default: 0.5%).
- Wick Size Threshold (%): Maximum size of the wicks to be considered minimal (Default: 0.3%).
3. Volume Settings:
- Include Volume in Evaluation: Whether to include trading volume in the qualitative score (Default: Enabled).
- Volume MA Period: Number of periods to calculate the moving average of volume (Default: 14).
4. Trend Settings:
- Moving Average Length: Number of periods for the Simple Moving Average used to determine the trend (Default: 50).
Calculations and Visualizations
- Quantitative Score: Difference between the closing and opening price, normalized to the opening price.
- Qualitative Score: Evaluation based on body size, wick size, trend, and volume.
- Cumulative Scores: Average of green and red scores over the defined period.
- Score Difference: Difference between cumulative green and red scores to determine trend direction.
- Trend Analysis Table: Displays trend direction, trend strength, and trading recommendation in an easy-to-read table.
Plotting and Display
- Cumulative Scores: Displays cumulative green and red scores in green and red colors.
- Score Difference: Blue line chart to visualize the difference between green and red scores.
- Zero Line: Horizontal gray line as a reference point.
- Trend Analysis Table: Table in the top right of the chart showing current trend direction, strength, and trading recommendation.
Use Cases
- Trend Identification: Use the score difference and trend analysis table to quickly assess the current market sentiment.
- Trading Recommendations: Based on the table, decide whether a long or short entry is appropriate.
- Volume Analysis: Including volume helps to better understand the strength of a trend.
Benefits
- Comprehensive Analysis: Combines quantitative and qualitative methods for a deeper market analysis.
- User-Friendly: Easy parameter adjustments allow for personalized use.
- Visually Appealing: Clear charts and tables facilitate data interpretation.
- Flexible: Adaptable to various trading strategies and timeframes.
Installation and Usage
1. Installation:
- Copy the provided Pine Script code.
- Go to TradingView and open the Pine Script Editor.
- Paste the code and save the script.
- Add the indicator to your chart.
2. Customization:
- Adjust the parameters according to your trading preferences.
- Monitor the cumulative scores and the trend analysis table for trading decisions.
Conclusion
The Qualitative and Quantitative Candlestick Score [CHE] offers a comprehensive analysis of market conditions by combining quantitative and qualitative evaluation methods. With its user-friendly settings and clear visualizations, this indicator is a valuable tool for traders seeking informed and precise trading decisions.
Best regards and happy trading
Chervolino
Developed by: Chervolino
Version: 1.0
License: Free to use and customize on TradingView.
For any questions or feedback, feel free to contact me through the TradingView community.
Note: This indicator is a tool to assist with trading decisions and does not replace professional financial advice. Use it responsibly and thoroughly test it before incorporating it into your trading strategies.
Skrypt open-source
W zgodzie z duchem TradingView twórca tego skryptu udostępnił go jako open-source, aby użytkownicy mogli przejrzeć i zweryfikować jego działanie. Ukłony dla autora. Korzystanie jest bezpłatne, jednak ponowna publikacja kodu podlega naszym Zasadom serwisu.
Wyłączenie odpowiedzialności
Informacje i publikacje nie stanowią i nie powinny być traktowane jako porady finansowe, inwestycyjne, tradingowe ani jakiekolwiek inne rekomendacje dostarczane lub zatwierdzone przez TradingView. Więcej informacji znajduje się w Warunkach użytkowania.