OPEN-SOURCE SCRIPT
VolSum

Google Translation------------------------------------------------------------------------------------------------------------------------------------------
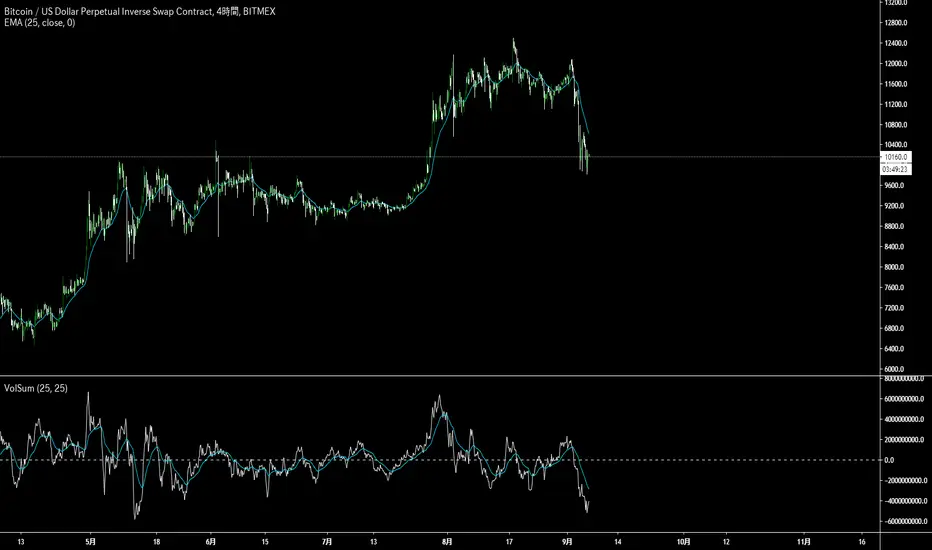
If the closing price is higher than the opening price, the volume is positive and reverse.
If the closing price is smaller than the opening price, the volume is negative and their defined period
It is an indicator that I thought that I would like to see how the shape changes compared to the price chart
when the sum of is calculated.
The white line is the sum of the output and the light blue line is the white line ema.
日本語---------------------------------------------------------------------------------------------------------------------------------------------------------
終値が始値より大きければ出来高をプラスに逆である終値が始値より小さければ出来高をマイナスにしそれらの定められた期間
の合計(sum)を出したら価格チャートと比較して形がどのように変化するか見てみたいと思い作ったインジケーターです。
白い線が出来高のsumで水色の線は白い線のemaになります。
Skrypt open-source
W zgodzie z duchem TradingView twórca tego skryptu udostępnił go jako open-source, aby użytkownicy mogli przejrzeć i zweryfikować jego działanie. Ukłony dla autora. Korzystanie jest bezpłatne, jednak ponowna publikacja kodu podlega naszym Zasadom serwisu.
Wyłączenie odpowiedzialności
Informacje i publikacje nie stanowią i nie powinny być traktowane jako porady finansowe, inwestycyjne, tradingowe ani jakiekolwiek inne rekomendacje dostarczane lub zatwierdzone przez TradingView. Więcej informacji znajduje się w Warunkach użytkowania.