OPEN-SOURCE SCRIPT
Hourly Trading System (Zeiierman)
█ Overview
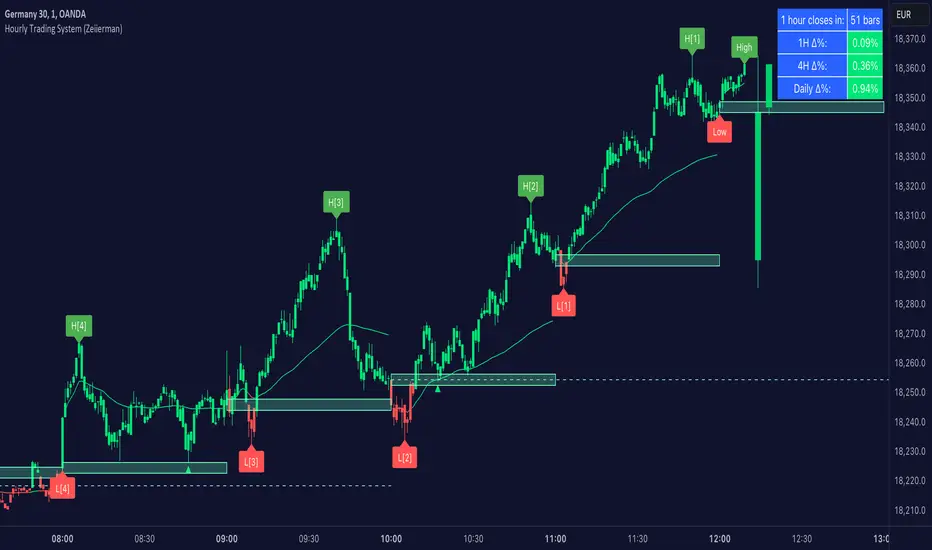
The Hourly Trading System (Zeiierman) is designed to enhance your trading by highlighting critical price levels and trends on an hourly basis. This indicator plots the open prices of hourly and 4-hour candles, visualizes retests, displays average price lines, and overlays higher timeframe candlesticks. It is particularly beneficial for intraday traders seeking to capitalize on short-term price movements and volume patterns.

█ How It Works
This indicator works by plotting significant price levels and zones based on hourly and 4-hour candle opens. It also includes functionalities for identifying retests of these levels, calculating and displaying average prices, and showing high and low labels for each hour.
█ Timeframe
The Hourly Trading System is designed to be used on the 1-minute or 5-minute timeframe. This system is tailored for intraday trading, allowing traders to find optimal entries around hourly opening levels and providing an easy method to identify the hourly trend. It works effectively on any market.
█ How to Use
Trend Analysis
Quickly gauge where the current price stands relative to key hourly and 4-hour levels. The plotted lines and zones serve as potential support and resistance areas, helping traders identify crucial points for entry or exit.

Utilize the 1-hour average and higher timeframe candles to understand the overall market trend. Aligning intraday strategies with larger trends can enhance trading decisions.

Use the bar coloring to quickly gauge the 1-hour trend on a lower timeframe. The bar colors indicate whether the hourly trend is bullish (green) or bearish (red), helping traders make quicker decisions in alignment with the overall trend.

Retest Identification
Enable retest signals to see where the price retested the hourly open levels. These retest points often signal strong price reactions, offering opportunities for trades based on support/resistance flips.

Liquidity Sweep Strategy
Another common and effective strategy is the liquidity sweep. This involves identifying key levels where liquidity is likely to accumulate, such as previous hour highs and lows, and observing how the price interacts with these price levels. When the price sweeps through these levels, triggering stop-loss orders or pending orders, it often results in a sharp price movement followed by a reversal. Traders can capitalize on these movements by entering trades in the direction of the reversal once the liquidity sweep has occurred.
Equal Highs and Lows Strategy
The Equal Highs and Lows strategy leverages the concept of identifying levels where the price forms multiple highs or lows at the same level over different hourly periods. These equal highs and lows often indicate strong support or resistance levels where liquidity is accumulated. When the price approaches these levels, it is likely to trigger stop-loss orders and lead to significant price movements. Traders can look for breakouts or reversals around these levels to enter trades with higher probability setups.

█ Settings
-----------------
Disclaimer
The information contained in my Scripts/Indicators/Ideas/Algos/Systems does not constitute financial advice or a solicitation to buy or sell any securities of any type. I will not accept liability for any loss or damage, including without limitation any loss of profit, which may arise directly or indirectly from the use of or reliance on such information.
All investments involve risk, and the past performance of a security, industry, sector, market, financial product, trading strategy, backtest, or individual's trading does not guarantee future results or returns. Investors are fully responsible for any investment decisions they make. Such decisions should be based solely on an evaluation of their financial circumstances, investment objectives, risk tolerance, and liquidity needs.
My Scripts/Indicators/Ideas/Algos/Systems are only for educational purposes!
The Hourly Trading System (Zeiierman) is designed to enhance your trading by highlighting critical price levels and trends on an hourly basis. This indicator plots the open prices of hourly and 4-hour candles, visualizes retests, displays average price lines, and overlays higher timeframe candlesticks. It is particularly beneficial for intraday traders seeking to capitalize on short-term price movements and volume patterns.
█ How It Works
This indicator works by plotting significant price levels and zones based on hourly and 4-hour candle opens. It also includes functionalities for identifying retests of these levels, calculating and displaying average prices, and showing high and low labels for each hour.
█ Timeframe
The Hourly Trading System is designed to be used on the 1-minute or 5-minute timeframe. This system is tailored for intraday trading, allowing traders to find optimal entries around hourly opening levels and providing an easy method to identify the hourly trend. It works effectively on any market.
█ How to Use
Trend Analysis
Quickly gauge where the current price stands relative to key hourly and 4-hour levels. The plotted lines and zones serve as potential support and resistance areas, helping traders identify crucial points for entry or exit.
Utilize the 1-hour average and higher timeframe candles to understand the overall market trend. Aligning intraday strategies with larger trends can enhance trading decisions.
Use the bar coloring to quickly gauge the 1-hour trend on a lower timeframe. The bar colors indicate whether the hourly trend is bullish (green) or bearish (red), helping traders make quicker decisions in alignment with the overall trend.
Retest Identification
Enable retest signals to see where the price retested the hourly open levels. These retest points often signal strong price reactions, offering opportunities for trades based on support/resistance flips.
One effective strategy to incorporate is looking for price flips when a new hour starts. This approach involves monitoring price action at the beginning of each hour. If the price breaks and retests the hourly open level with strong momentum, it could indicate a potential trend reversal or continuation. This strategy is effective in volatile markets where price movements are significant at the start of each new hour.
Liquidity Sweep Strategy
Another common and effective strategy is the liquidity sweep. This involves identifying key levels where liquidity is likely to accumulate, such as previous hour highs and lows, and observing how the price interacts with these price levels. When the price sweeps through these levels, triggering stop-loss orders or pending orders, it often results in a sharp price movement followed by a reversal. Traders can capitalize on these movements by entering trades in the direction of the reversal once the liquidity sweep has occurred.
Equal Highs and Lows Strategy
The Equal Highs and Lows strategy leverages the concept of identifying levels where the price forms multiple highs or lows at the same level over different hourly periods. These equal highs and lows often indicate strong support or resistance levels where liquidity is accumulated. When the price approaches these levels, it is likely to trigger stop-loss orders and lead to significant price movements. Traders can look for breakouts or reversals around these levels to enter trades with higher probability setups.
█ Settings
- Zone Width: Specifies the width of the zone around the 1-Hour Open as a percentage. Adjust this to widen or narrow the zone.
- Show Retests: Enables or disables the display of retest markers. Retest markers show where the price has retested the 1-Hour Open line.
- Number of Retests: Sets the number of retests to display. Adjust this to see more or fewer retest markers.
- Volume Filter: Enables or disables the volume filter for retests. Use this to highlight retests with significant volume.
- Volume Filter Length: Sets the length of the volume filter, smoothing the volume data to reduce noise.
- 1-Hour Average Line: Enables or disables the 1-hour average price line. This line shows the average price over the past hour.
- Hourly High & Low Labels: Enables or disables the display of hourly high and low labels, marking the highest and lowest prices within each hour.
- Candlesticks: Enables or disables the display of candlesticks on the chart, providing a detailed view of price action.
- Bar Color: Enables or disables bar coloring based on price direction, with up bars in green and down bars in red.
- Timeframe: Sets the timeframe for higher timeframe candles. Adjust this to match the period you want to analyze.
- Number of Candles: Sets the number of higher timeframe candles to display. Increase this to see more candles on the chart.
- Location: Sets the location for higher timeframe candles, allowing you to position them left or right on the chart.
-----------------
Disclaimer
The information contained in my Scripts/Indicators/Ideas/Algos/Systems does not constitute financial advice or a solicitation to buy or sell any securities of any type. I will not accept liability for any loss or damage, including without limitation any loss of profit, which may arise directly or indirectly from the use of or reliance on such information.
All investments involve risk, and the past performance of a security, industry, sector, market, financial product, trading strategy, backtest, or individual's trading does not guarantee future results or returns. Investors are fully responsible for any investment decisions they make. Such decisions should be based solely on an evaluation of their financial circumstances, investment objectives, risk tolerance, and liquidity needs.
My Scripts/Indicators/Ideas/Algos/Systems are only for educational purposes!
Skrypt open-source
W zgodzie z duchem TradingView twórca tego skryptu udostępnił go jako open-source, aby użytkownicy mogli przejrzeć i zweryfikować jego działanie. Ukłony dla autora. Korzystanie jest bezpłatne, jednak ponowna publikacja kodu podlega naszym Zasadom serwisu.
Access my indicators at: zeiierman.com
Join Our Free Discord: discord.gg/zeiiermantrading
Join Our Free Discord: discord.gg/zeiiermantrading
Wyłączenie odpowiedzialności
Informacje i publikacje nie stanowią i nie powinny być traktowane jako porady finansowe, inwestycyjne, tradingowe ani jakiekolwiek inne rekomendacje dostarczane lub zatwierdzone przez TradingView. Więcej informacji znajduje się w Warunkach użytkowania.