OPEN-SOURCE SCRIPT
Zaktualizowano Market Internals Dashboard (Table) v5 - Fixed
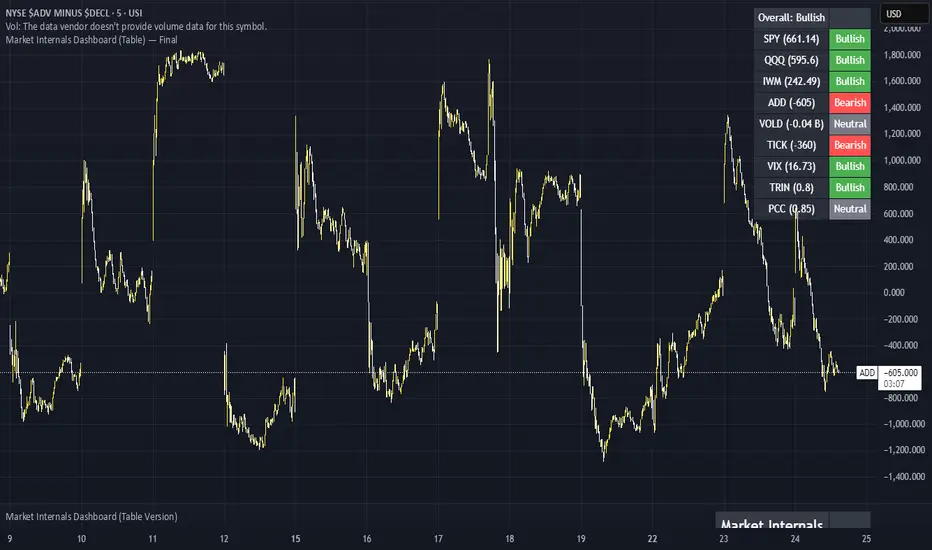
Has a Dashboard for Market Internals and 3 Indices, very helpful
Informacje o Wersji
Here’s a breakdown for each category and the key thresholds traders watch:1.
> +1000 (NYSE): Strong upside participation → bias calls.
< –1000: Broad downside participation → bias puts.
Between –500 and +500 = choppy / indecision.
2.
Measures number of stocks upticking vs. downticking.
+800 or higher spikes → strong buying pressure.
–800 or lower spikes → strong selling pressure.
Constant readings above 0 = bullish tape.
Constant readings below 0 = bearish tape.
3.
Falling VIX intraday → risk-on, bias calls.
Rising VIX intraday → risk-off, bias puts.
<15 = complacency (strong bullish environment).
>20 = fear (bearish environment).
Watch directional change intraday, not just level.
4.
TRIN = advancing/declining volume ÷ advancing/declining issues.
<1.0 = bullish (volume favors advancers).
>1.0 = bearish (volume favors decliners).
Extreme <0.7 → very bullish, sometimes exhaustion.
Extreme >1.3–1.5 → very bearish, possible capitulation.
5. Put/Call Ratio (USI:PCC)
<0.8 = bullish sentiment (calls overweight puts).
>1.2 = bearish sentiment (puts overweight calls).
Middle ground (0.9–1.1) = neutral chop.
Note: Works best as a contrarian signal on extremes.
6. SPY, QQQ, IWM (Price vs. 20 SMA in our script)
Above 20 SMA = bullish bias.
Below 20 SMA = bearish bias.
Confirms what internals are saying.
How to Use Together
✅ Strong Call Setup:
ADD > +1000, TICK persistently > 0, TRIN < 1, VIX flat or falling, PCC < 0.8.
✅ Strong Put Setup:
ADD < –1000, TICK persistently < 0, TRIN > 1, VIX rising, PCC > 1.2.
⚠️ Neutral / Chop Zone:
ADD between –500 and +500, TICK flipping around 0, TRIN near 1, VIX flat → avoid trading until confirmation.
📈 How to Read VOLD (NYSE:VOLD)
Here are the key thresholds most pros use intraday:
VOLD Value Meaning Bias
+500M to +1B+ Strong upside volume – broad participation 📈 Call bias
+200M to +500M Moderate bullish volume 📈 Mild call bias
–200M to –500M Moderate bearish volume 📉 Mild put bias
–500M to –1B+ Strong downside volume – broad selling pressure 📉 Put bias
Near 0 Mixed or no conviction ⚠️ Chop zone – avoid trades
💡 Pro tip:
VOLD tends to trend all day once the session bias is set. If it’s above +500M early and rising, odds are the market closes bullish. Same for heavy negative VOLD.
Skrypt open-source
W zgodzie z duchem TradingView twórca tego skryptu udostępnił go jako open-source, aby użytkownicy mogli przejrzeć i zweryfikować jego działanie. Ukłony dla autora. Korzystanie jest bezpłatne, jednak ponowna publikacja kodu podlega naszym Zasadom serwisu.
Wyłączenie odpowiedzialności
Informacje i publikacje nie stanowią i nie powinny być traktowane jako porady finansowe, inwestycyjne, tradingowe ani jakiekolwiek inne rekomendacje dostarczane lub zatwierdzone przez TradingView. Więcej informacji znajduje się w Warunkach użytkowania.