PROTECTED SOURCE SCRIPT
Zaktualizowano RSIEW V2 Thermal Falsecolor show Hot (Impulse) Cold (Correction)
HI BIG PLAYER AROUND THE WORLD,
here is my new creation of modified RSI Indikator.
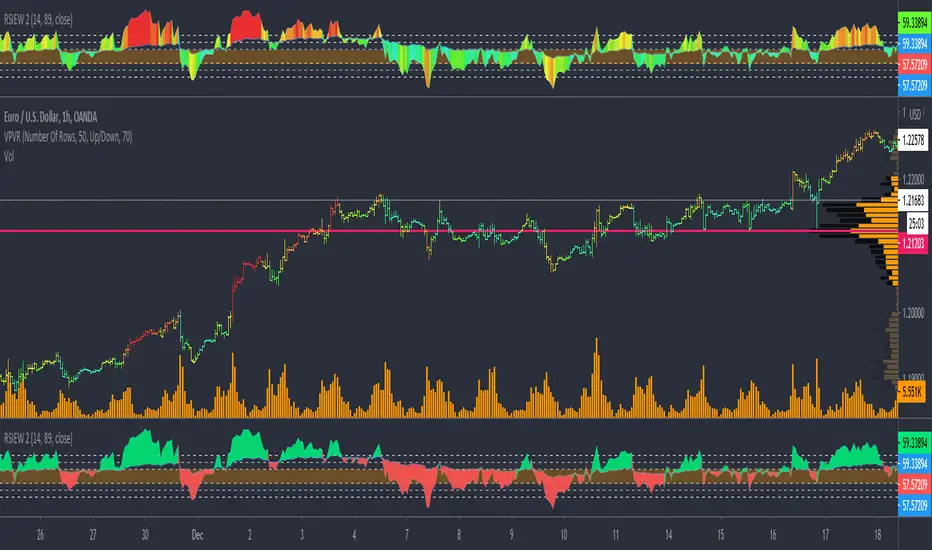
In order to the RSIEW Version 1 (look below this text) I build a thermal rainbow chart that shows the spectrum with all overbought and oversell phases. The colour spectrum can be compared with a thermal imaging camera.
In one hand, the hottest candles (going into red) show the extrem points of the chart. In trend direction this is often wave 3 of Elliott Waves theory and in correction phase it show the bounce period.
In other hand, the coldest candles (going into blue) show the weak points of the chart. In trend direction this is often a "cooling down" and in big correction phases it demonstrate frozen prices (really unattractive trading time).
Have fun with this and give me a feedback.
Of course, you are invited to follow me.
KIND REGARDS
NXT2017
here is my new creation of modified RSI Indikator.
In order to the RSIEW Version 1 (look below this text) I build a thermal rainbow chart that shows the spectrum with all overbought and oversell phases. The colour spectrum can be compared with a thermal imaging camera.
In one hand, the hottest candles (going into red) show the extrem points of the chart. In trend direction this is often wave 3 of Elliott Waves theory and in correction phase it show the bounce period.
In other hand, the coldest candles (going into blue) show the weak points of the chart. In trend direction this is often a "cooling down" and in big correction phases it demonstrate frozen prices (really unattractive trading time).
Have fun with this and give me a feedback.
Of course, you are invited to follow me.
KIND REGARDS
NXT2017
Informacje o Wersji
- add manually color choose functions- fixed bugs on color
Skrypt chroniony
Ten skrypt został opublikowany jako zamknięty kod źródłowy. Można z tego korzystać swobodnie i bez żadnych ograniczeń — więcej informacji znajduje się tutaj.
🐺 Wolfe Wave AutoPattern: nxt2017.com/ww
🎯 Elliott Wave Auto Counting: nxt2017.com/ew
💥 Impulse Scalper: nxt2017.com/im
📈 Cheapest Entry: nxt2017.com/pi
Discount Coupon:
nxtcoupon20 for -20%
🎯 Elliott Wave Auto Counting: nxt2017.com/ew
💥 Impulse Scalper: nxt2017.com/im
📈 Cheapest Entry: nxt2017.com/pi
Discount Coupon:
nxtcoupon20 for -20%
Wyłączenie odpowiedzialności
Informacje i publikacje nie stanowią i nie powinny być traktowane jako porady finansowe, inwestycyjne, tradingowe ani jakiekolwiek inne rekomendacje dostarczane lub zatwierdzone przez TradingView. Więcej informacji znajduje się w Warunkach użytkowania.