PROTECTED SOURCE SCRIPT
Feigenbaum Inspired Bifurcation Indicator

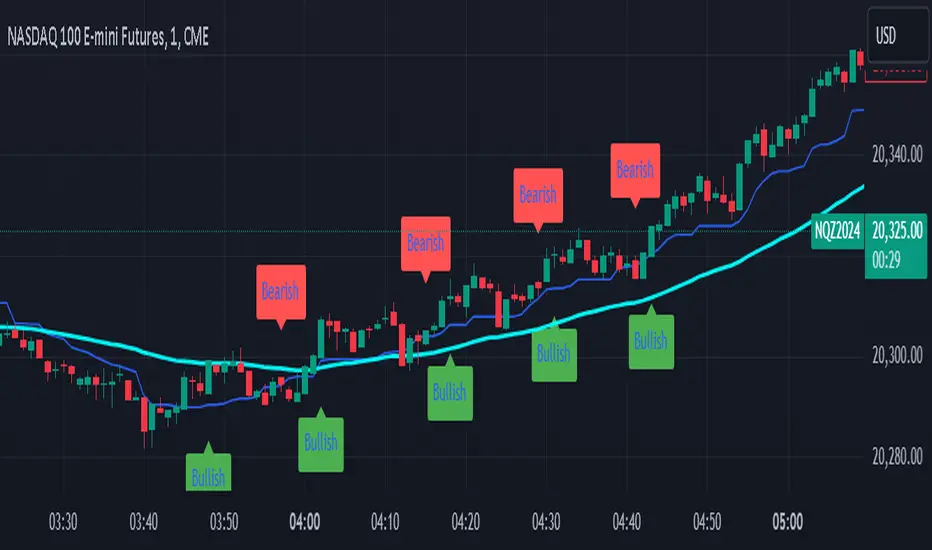
Its a work in progess but here you go. I pair it with a 50 EMA for better direction.
1. Bullish Trend Signal:
Green Labels ("Bullish") are plotted below the price chart when a bullish trend is detected.
This is based on a crossover of two simple moving averages (short and long):
The short-term moving average (SMA) crosses above the long-term moving average, indicating a potential upward trend or buying opportunity.
2. Bearish Trend Signal:
Red Labels ("Bearish") are plotted above the price chart when a bearish trend is detected.
This occurs when the short-term moving average crosses below the long-term moving average, signaling a potential downward trend or selling opportunity.
3. Mid-Range Line (Optional):
A Blue Line is plotted on the chart, representing the mid-point between the highest high and lowest low over the given period (default is 14 bars).
This line can help visualize where the price is relative to its recent range.
Summary:
Bullish Labels (Green): Appear when a bullish crossover happens.
Bearish Labels (Red): Appear when a bearish crossover happens.
Mid-Range Line (Blue): Helps identify the midpoint of recent price ranges (can be turned off if not needed).
This is a simplified trend-following indicator based on moving average crossovers, giving you a quick visual cue of when trends are shifting. Let me know if you’d like further adjustments!
Skrypt chroniony
Ten skrypt został opublikowany jako zamknięty kod źródłowy. Można z tego korzystać swobodnie i bez żadnych ograniczeń — więcej informacji znajduje się tutaj.
Wyłączenie odpowiedzialności
Informacje i publikacje nie stanowią i nie powinny być traktowane jako porady finansowe, inwestycyjne, tradingowe ani jakiekolwiek inne rekomendacje dostarczane lub zatwierdzone przez TradingView. Więcej informacji znajduje się w Warunkach użytkowania.