OPEN-SOURCE SCRIPT
Zaktualizowano MA and Channel overlay

Some overlay utilities:
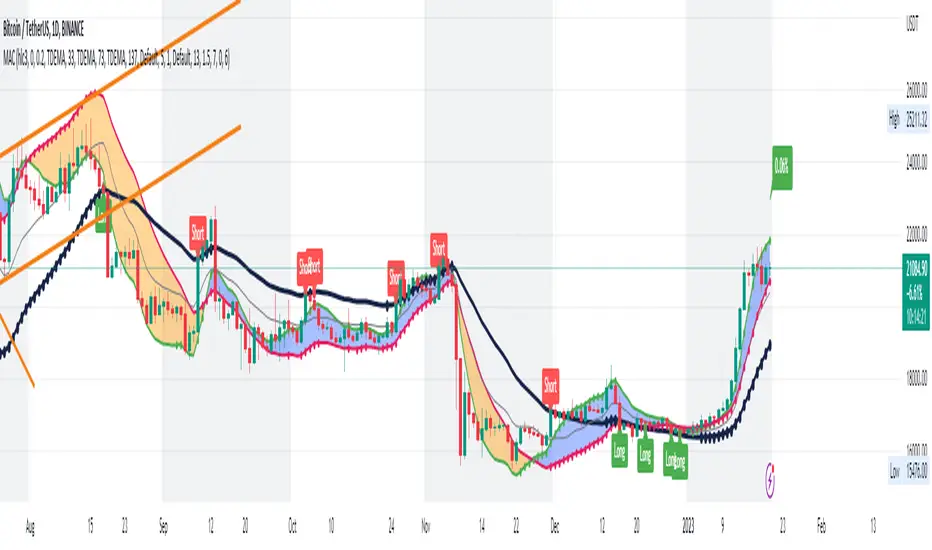
- Draw 3 moving averages (MA) with circles line.
- Option to choose type of MA to plot.
- Draw start point of those MA with a big cross.
- Option to draw channel: Donchian, Bollinger and Envelope.
- Option to draw stop loss line: ATR or Percentage.
- Draw background color in monthly, weekly, daily, intraday, ... chart (remember to choose your correct timezone if using intraday chart).
- Draw a label of last price.
- Draw next prices.
Informacje o Wersji
Added comments and showed stop loss line for demo purpose.Informacje o Wersji
Option to show / hide MAs.Informacje o Wersji
New chart view.Informacje o Wersji
Add intraday labels which show day number in month and weekday name.Informacje o Wersji
Add hour range to draw sleep time in intraday chart.Informacje o Wersji
Fixed time zone issue for exchange that has non-UTC timezone.Informacje o Wersji
Fix weekly background issue.Informacje o Wersji
Fix channel len issue.Informacje o Wersji
- Use TDEMA as the default MA now.- Use bigger periods to catch trend easier.
- Drawed a band between small and medium period (MA1 and MA2) lines.
- The position of this band and the big period line (MA3) is the key to check the trend now.
Skrypt open-source
W zgodzie z duchem TradingView twórca tego skryptu udostępnił go jako open-source, aby użytkownicy mogli przejrzeć i zweryfikować jego działanie. Ukłony dla autora. Korzystanie jest bezpłatne, jednak ponowna publikacja kodu podlega naszym Zasadom serwisu.
Wyłączenie odpowiedzialności
Informacje i publikacje nie stanowią i nie powinny być traktowane jako porady finansowe, inwestycyjne, tradingowe ani jakiekolwiek inne rekomendacje dostarczane lub zatwierdzone przez TradingView. Więcej informacji znajduje się w Warunkach użytkowania.