OPEN-SOURCE SCRIPT
Implied Volatility Levels
Overview:
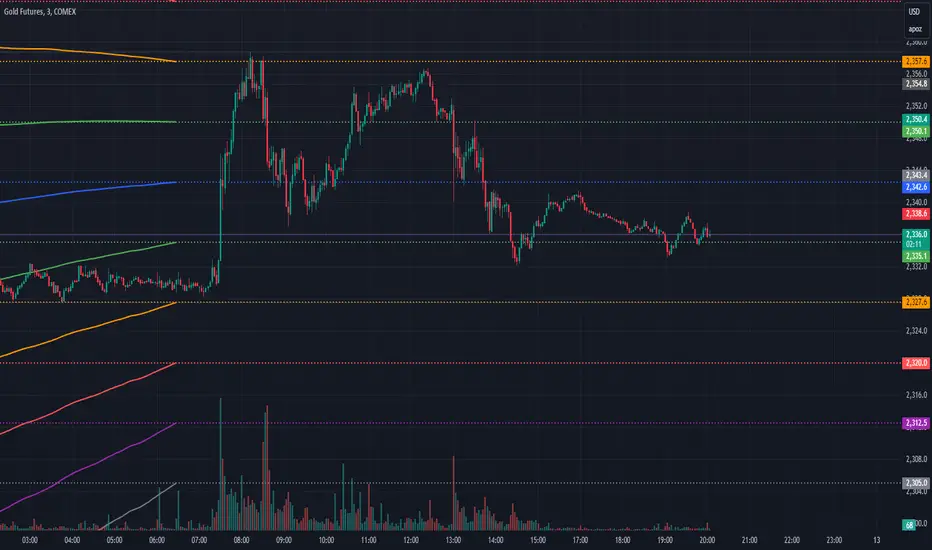
The Implied Volatility Levels Indicator is a powerful tool designed to visualize different levels of implied volatility on your trading chart. This indicator calculates various implied volatility levels based on historical price data and plots them as dynamic dotted lines, helping traders identify significant market thresholds and potential reversal points.
Features:
Multi-Level Implied Volatility: The indicator calculates and plots multiple levels of implied volatility, including the mean and both positive and negative standard deviation multiples.
Dynamic Updates: The levels update in real-time, reflecting the latest market conditions without cluttering your chart with outdated information.
Customizable Parameters: Users can adjust the lookback period and the standard deviation multiplier to tailor the indicator to their trading strategy.
Visual Clarity: Implied volatility levels are displayed using distinct colors and dotted lines, providing clear visual cues without obstructing the view of price action.
Support for Multiple Levels: Includes additional levels (up to ±5 standard deviations) for in-depth market analysis.
How It Works:
The indicator computes the standard deviation of the closing prices over a user-defined lookback period. It then calculates various implied volatility levels by adding and subtracting multiples of this standard deviation from the mean price. These levels are plotted as dotted lines on the chart, offering traders a clear view of the current market's volatility landscape.
Usage:
Identify Key Levels: Use the plotted lines to spot potential support and resistance levels based on implied volatility.
Analyze Market Volatility: Understand how volatile the market is relative to historical data.
Plan Entry and Exit Points: Make informed trading decisions by observing where the price is in relation to the implied volatility levels.
Parameters:
Lookback Period (Days): The number of days to consider for calculating historical volatility (default is 252 days).
Standard Deviation Multiplier: A multiplier to adjust the distance of the levels from the mean (default is 1.0).
This indicator is ideal for traders looking to incorporate volatility analysis into their technical strategy, providing a robust framework for anticipating market movements and potential reversals.
Skrypt open-source
W zgodzie z duchem TradingView twórca tego skryptu udostępnił go jako open-source, aby użytkownicy mogli przejrzeć i zweryfikować jego działanie. Ukłony dla autora. Korzystanie jest bezpłatne, jednak ponowna publikacja kodu podlega naszym Zasadom serwisu.
Wyłączenie odpowiedzialności
Informacje i publikacje nie stanowią i nie powinny być traktowane jako porady finansowe, inwestycyjne, tradingowe ani jakiekolwiek inne rekomendacje dostarczane lub zatwierdzone przez TradingView. Więcej informacji znajduje się w Warunkach użytkowania.